


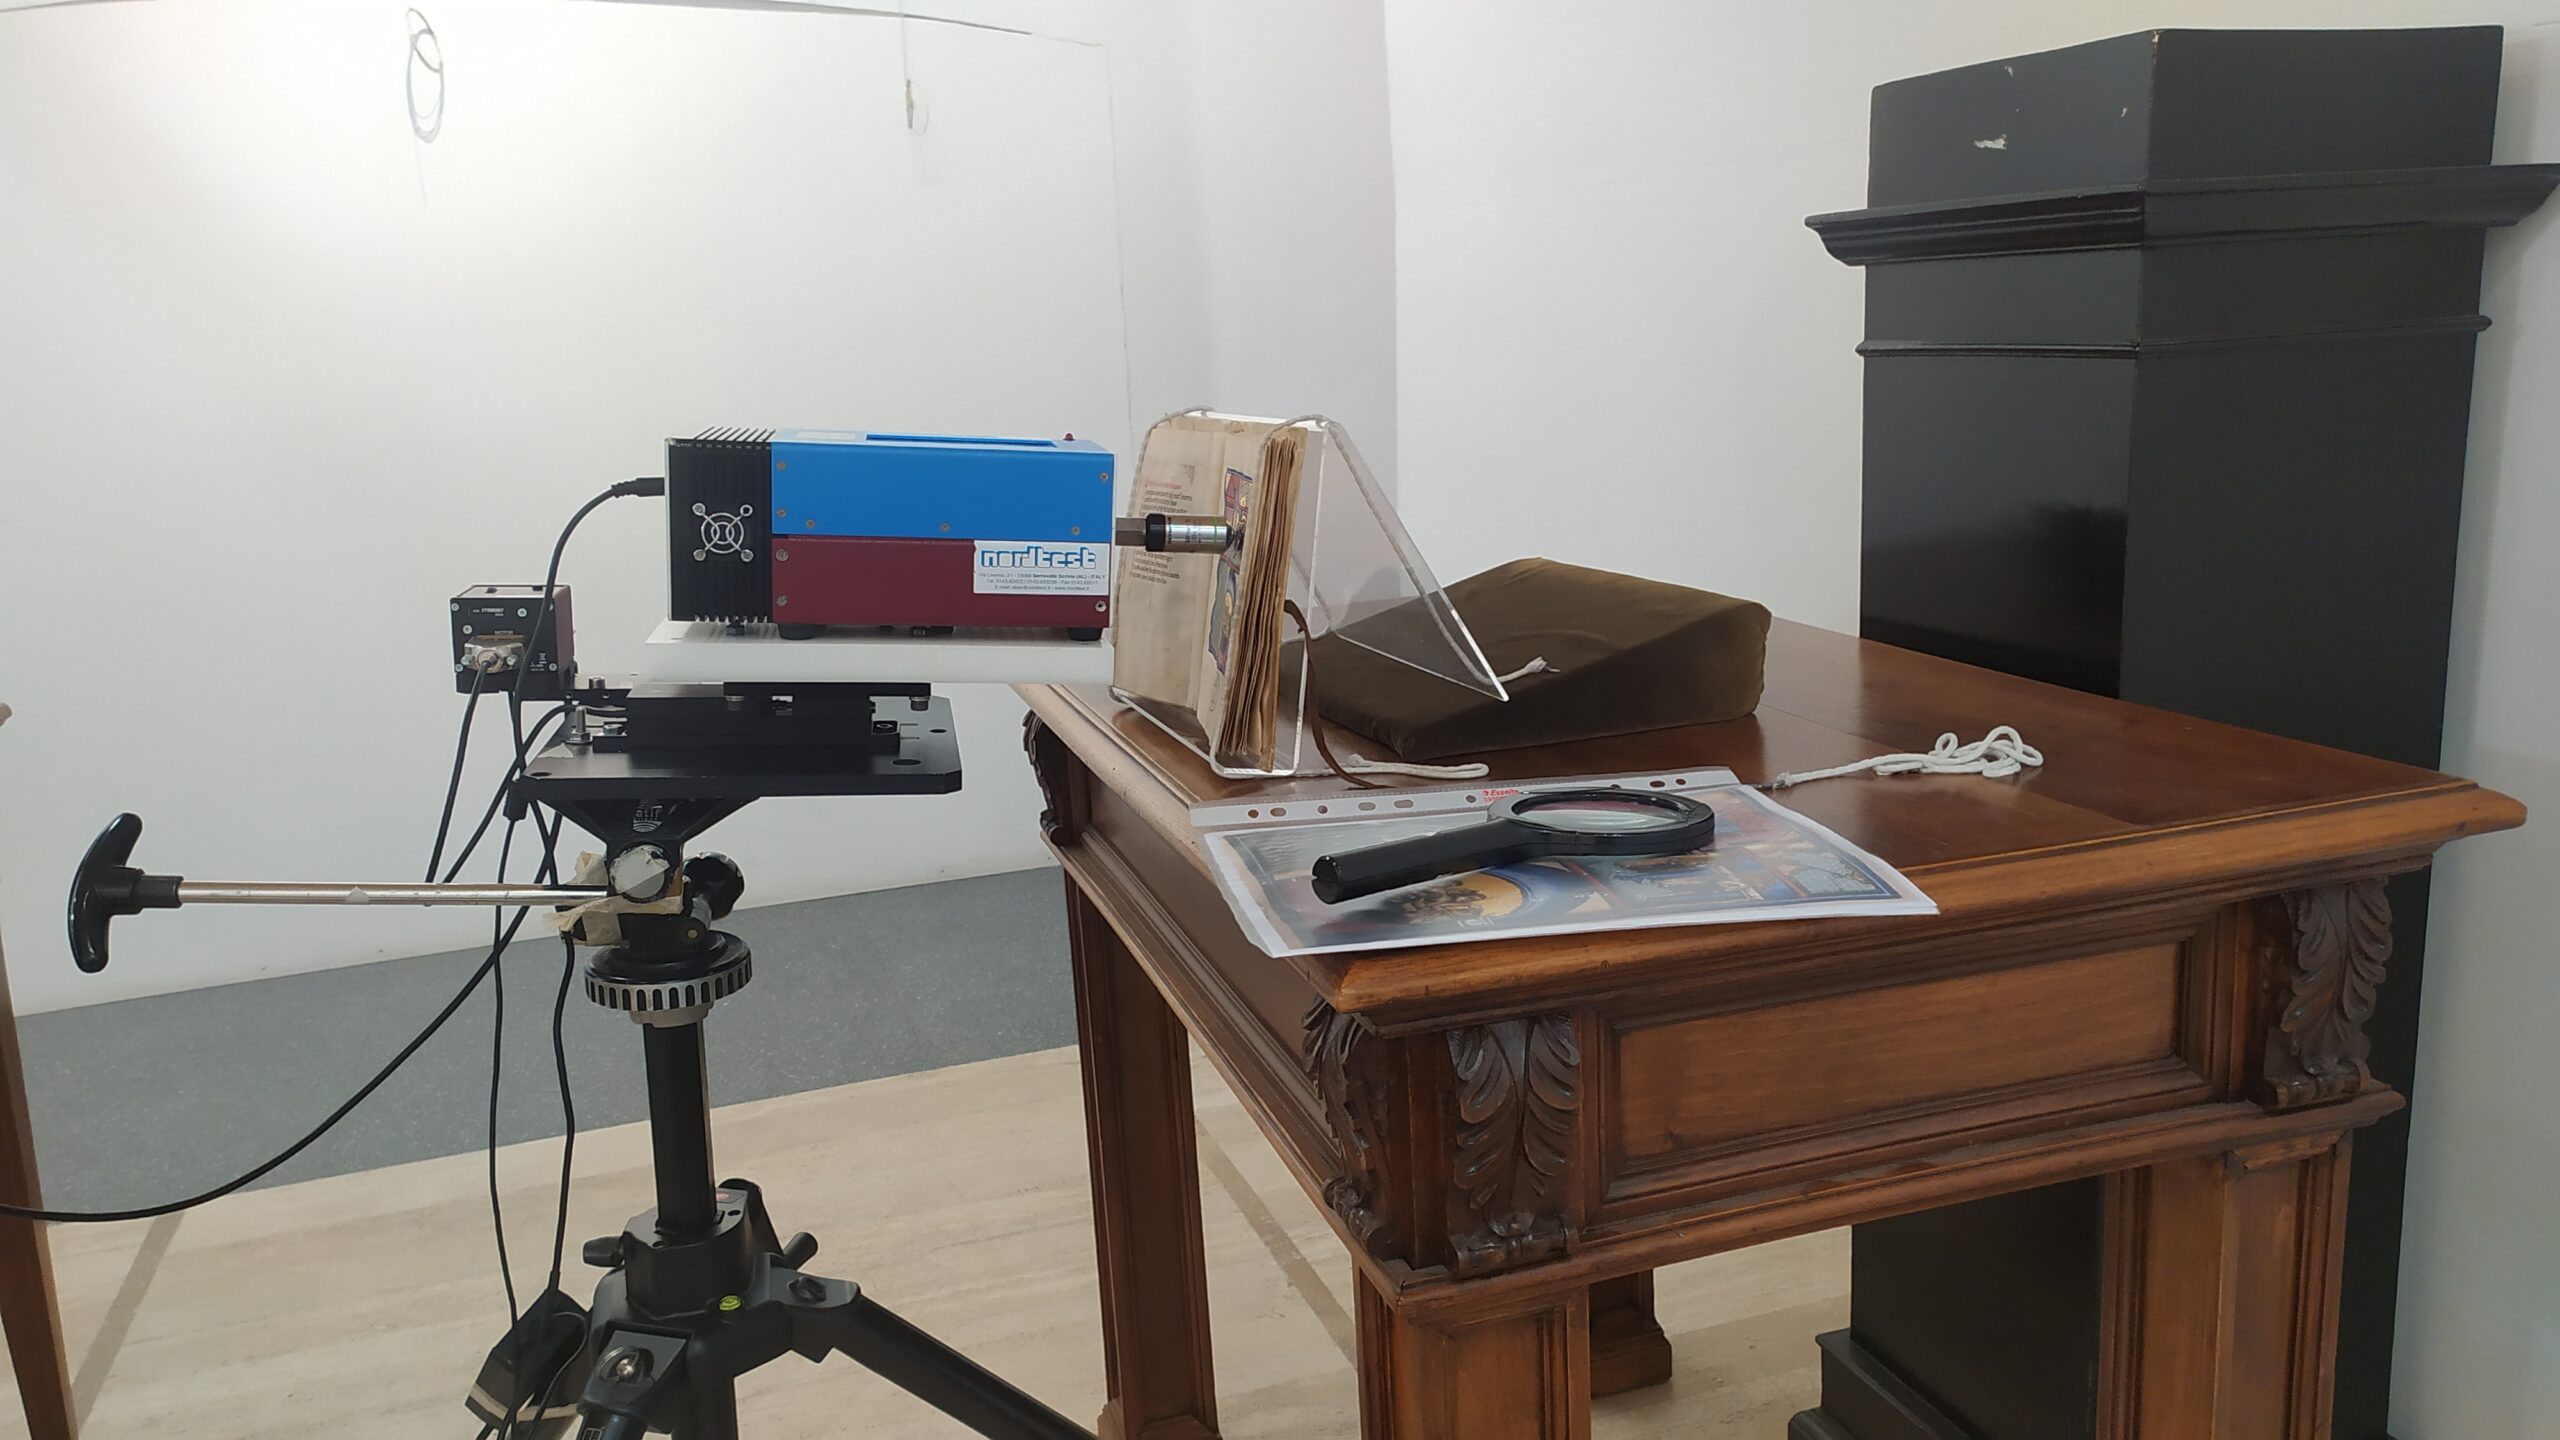
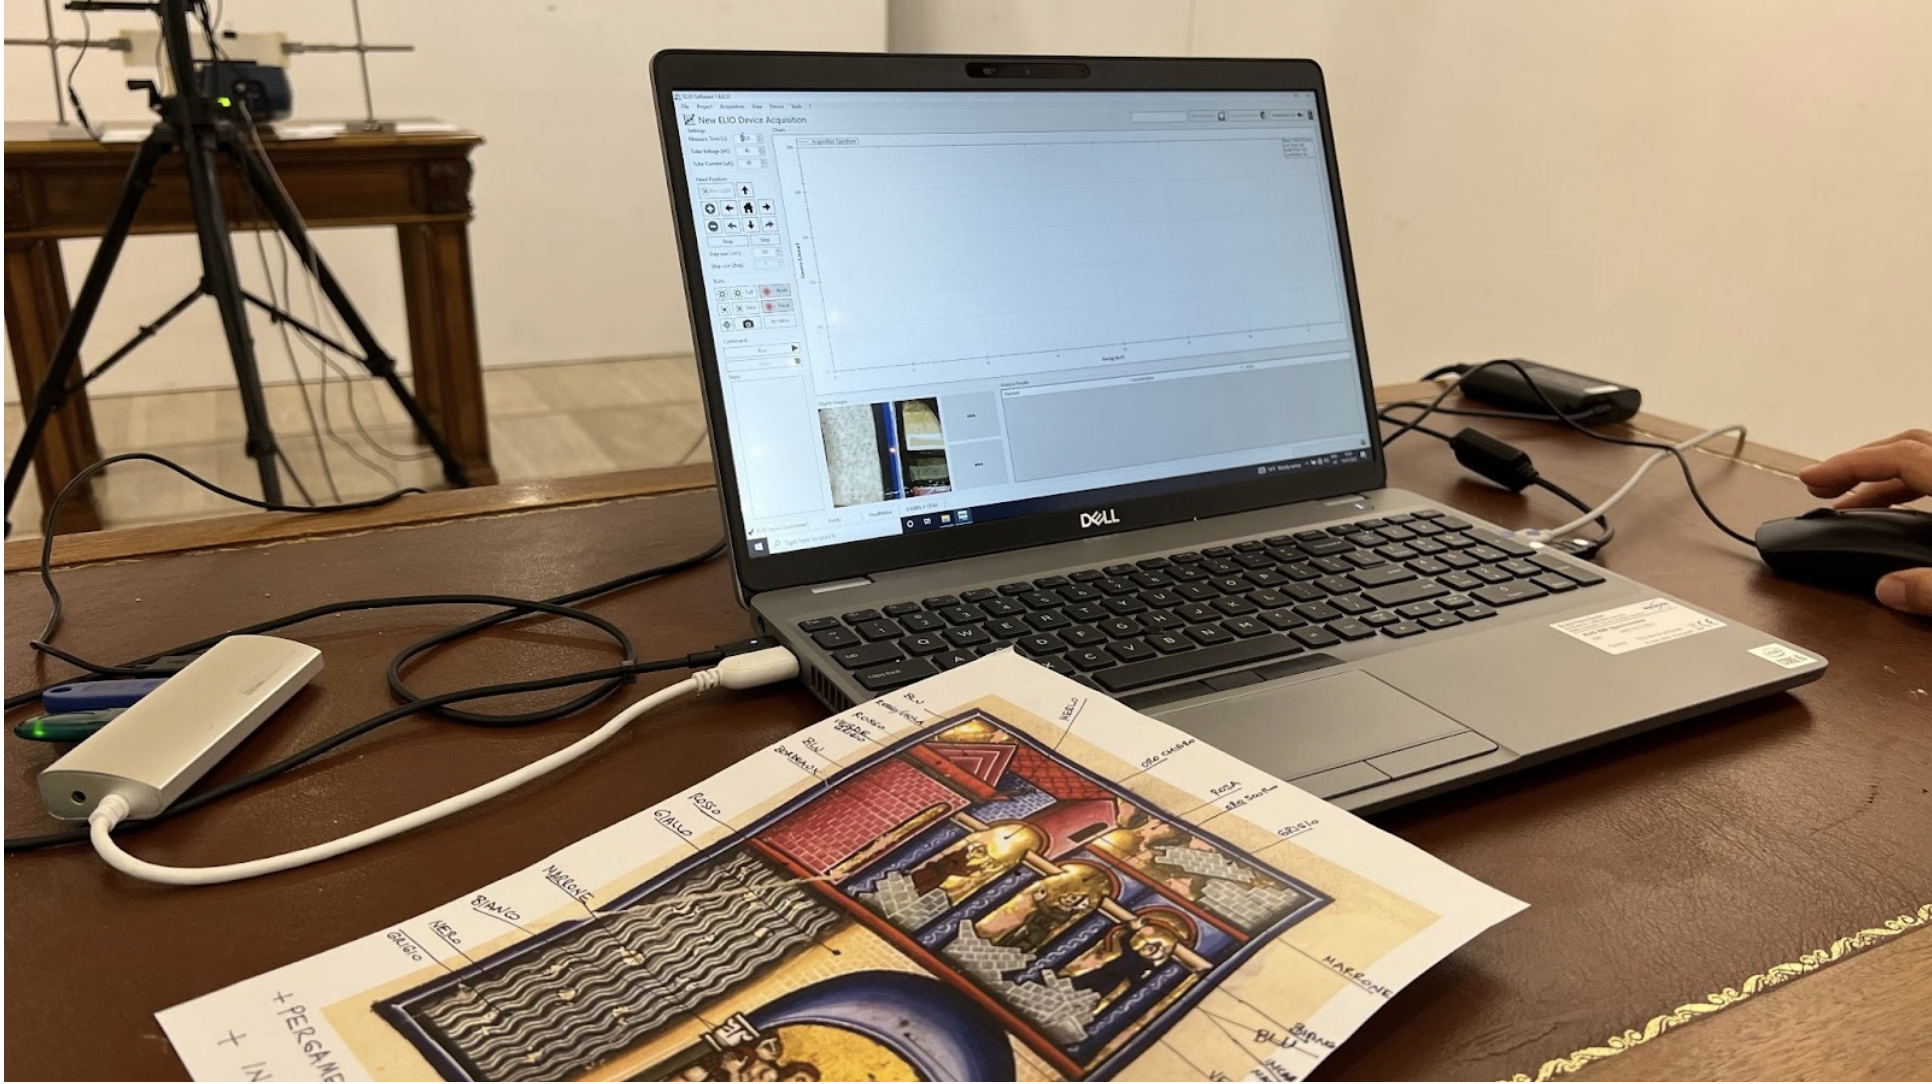
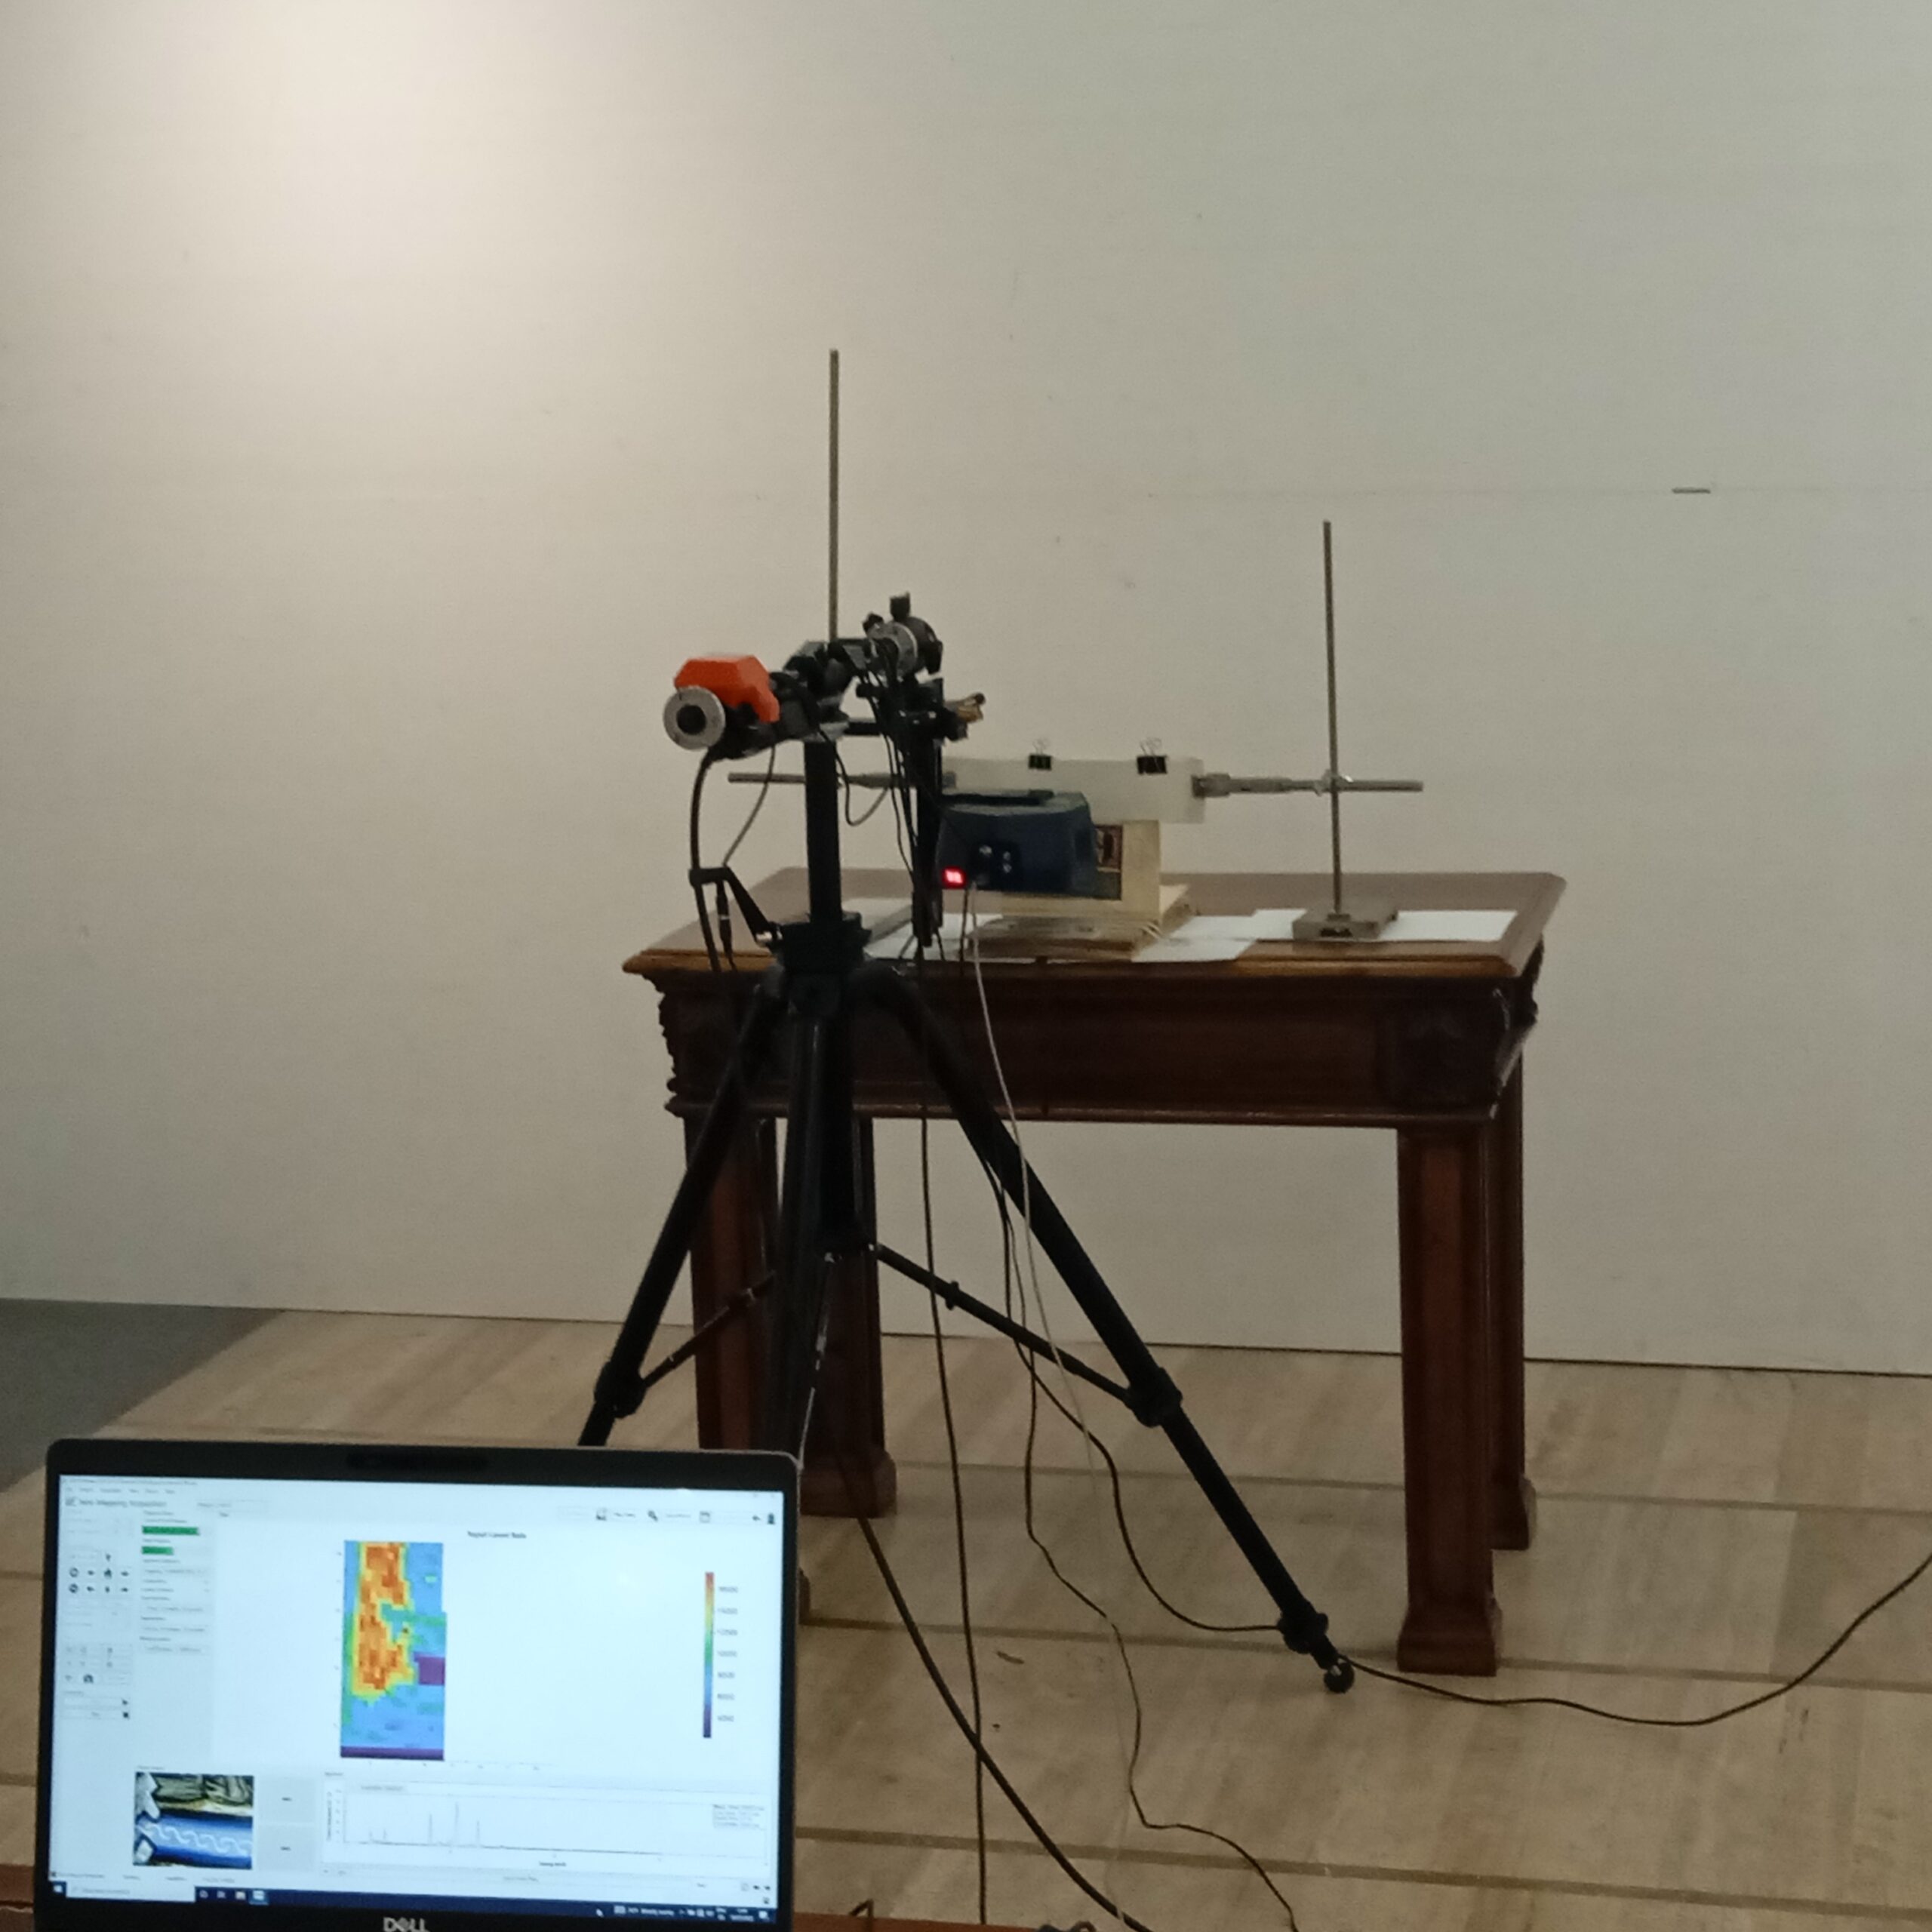
The first step involves setting up the measurement set, which consists of arranging the instrument on a micrometric stage and attaching the entire apparatus to a tripod. Finally, the instrument is to be connected to a PC from which commands will be issued to both the instrument and the stage.
Raman spectroscopy – System configuration
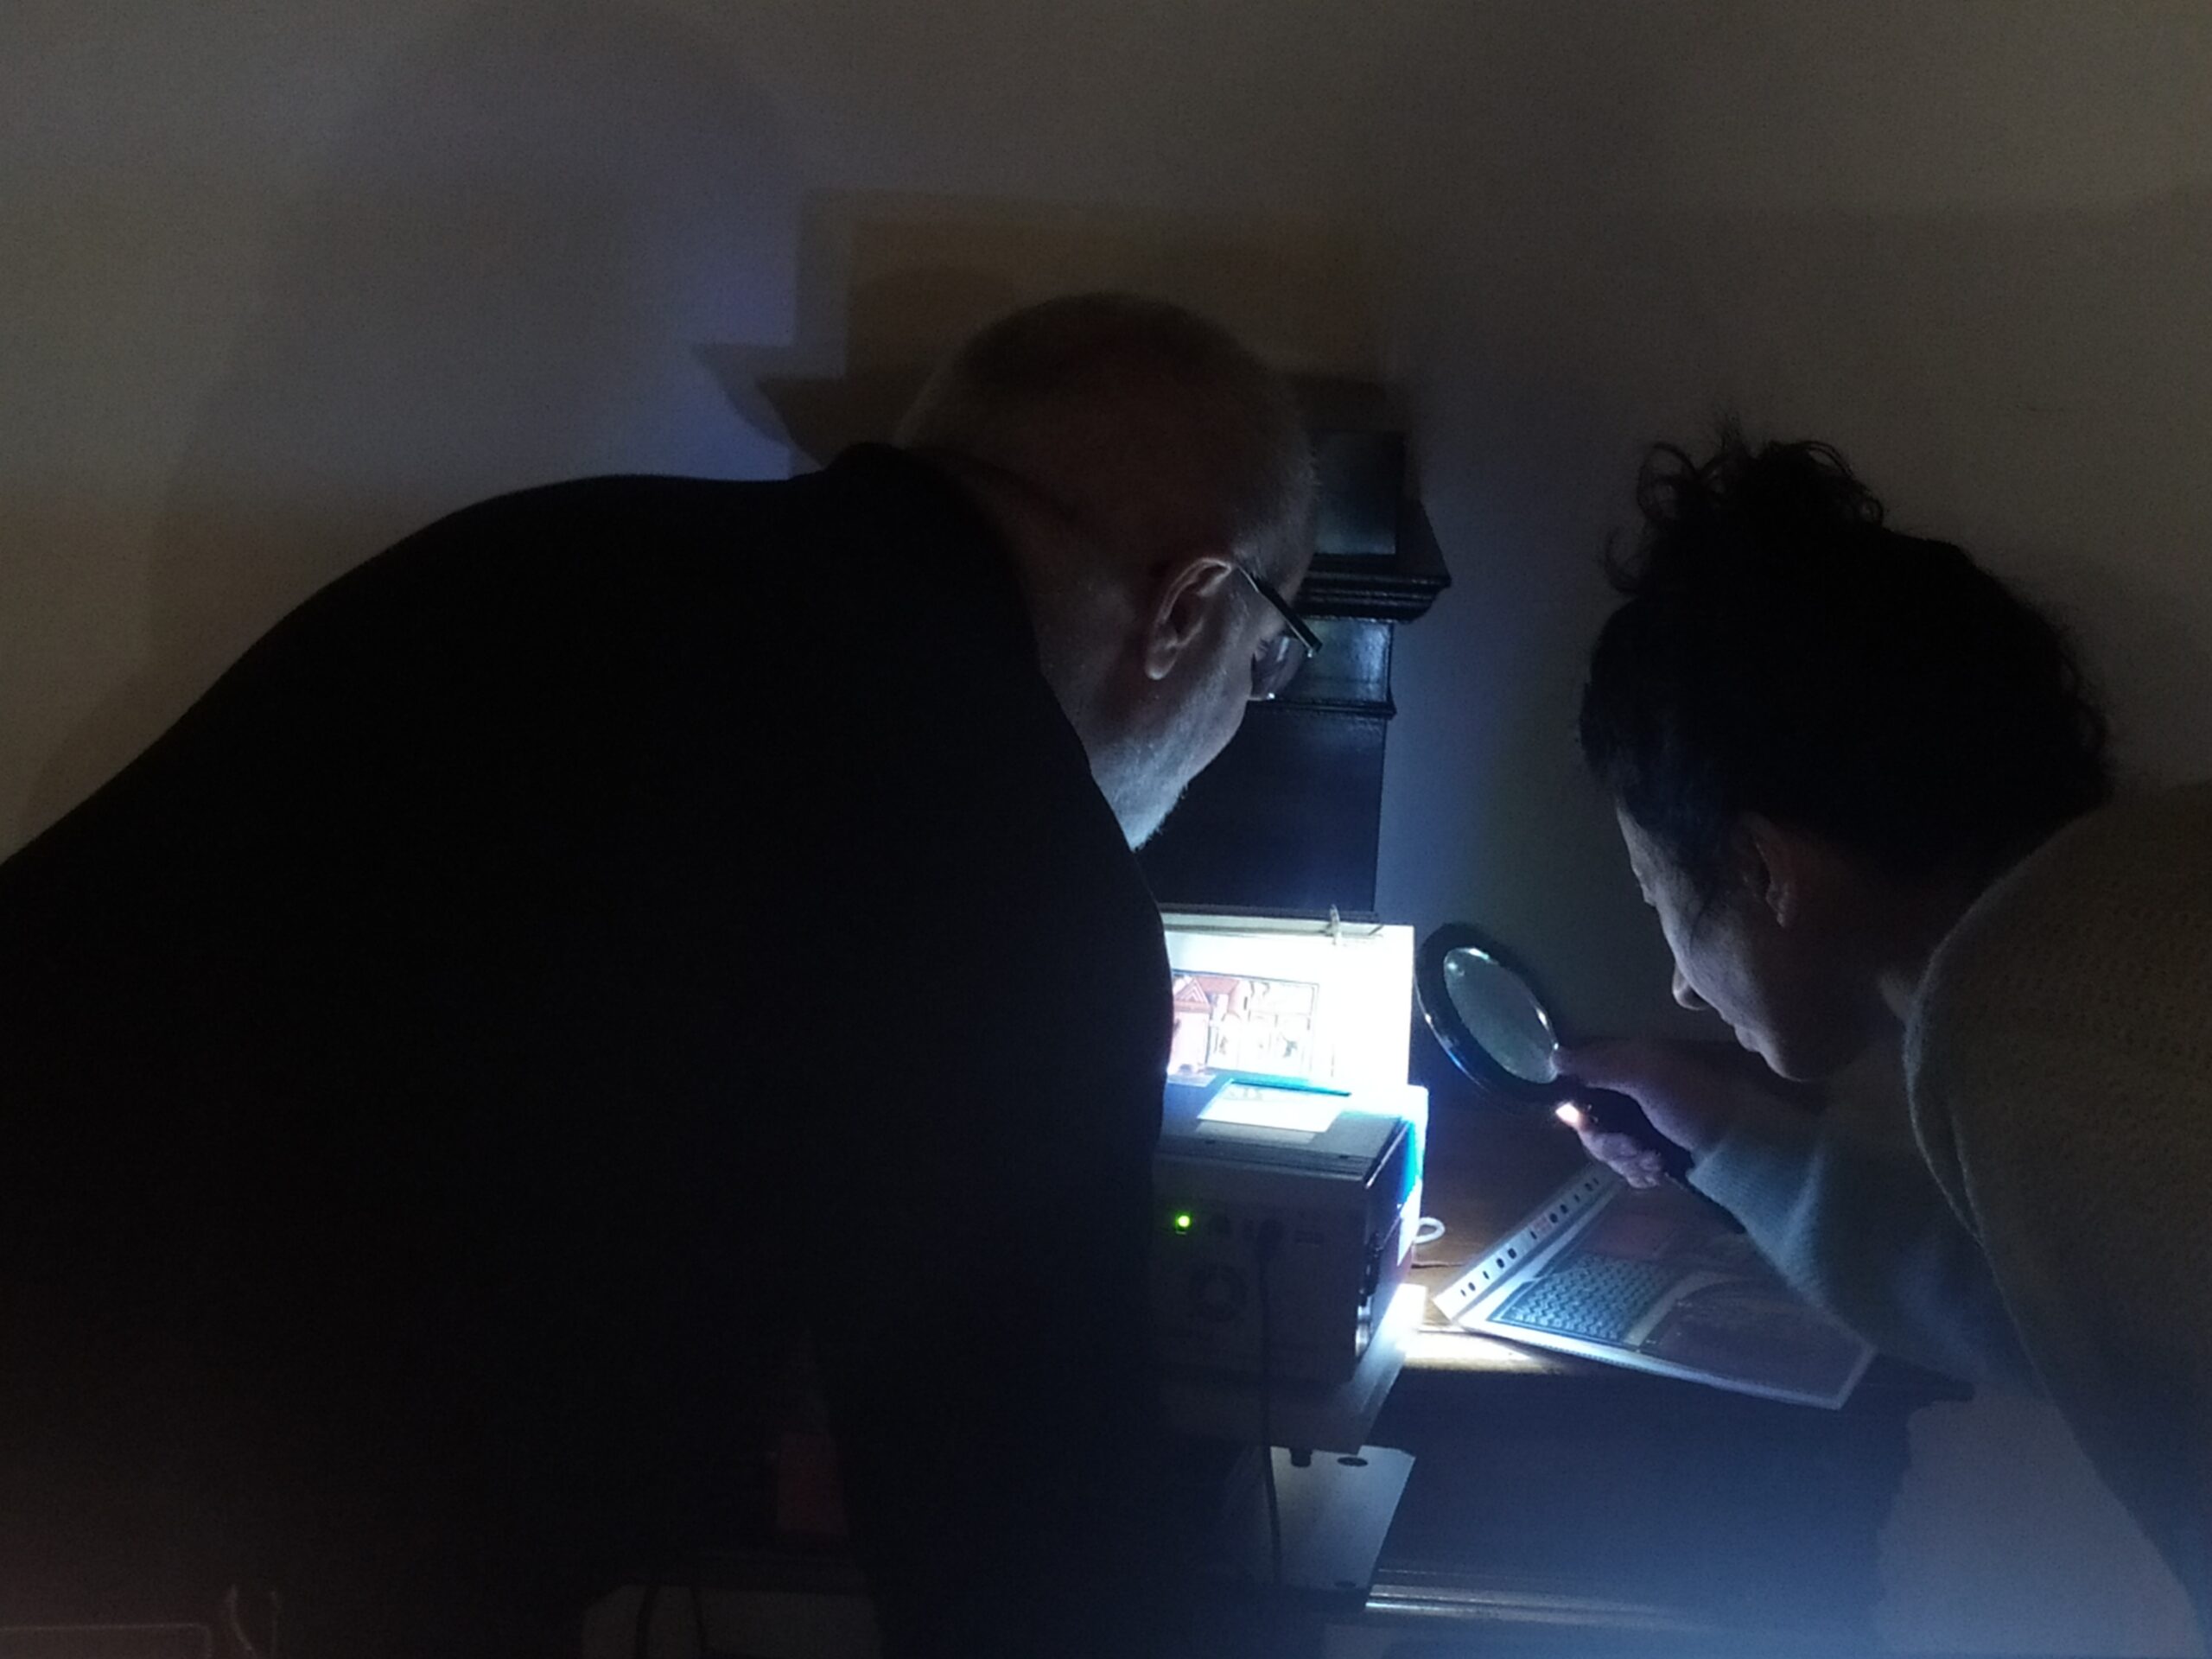
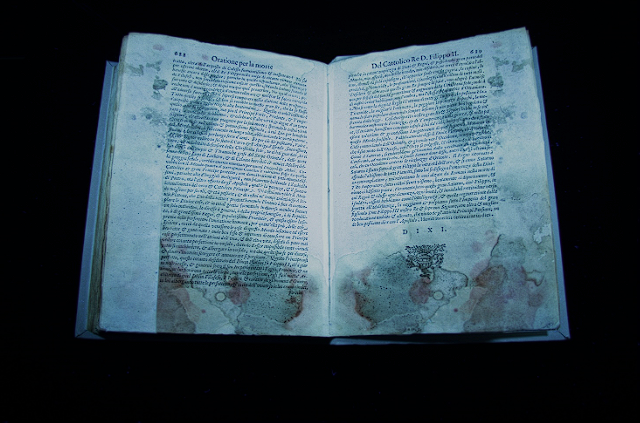
To select the measurement points, observe the colour fields on the surface of the manuscript, avoiding the darker ones, which are unlikely to emit a Raman signal useful for characterising compounds.
Raman spectroscopy – Selection of measuring points
After focusing the lens on the investigation area, the measurement consists of irradiating the surface of the manuscript with a laser source. The lens collects the Raman signal, which is then transformed into a spectrum, i.e. a series of peaks that are characteristic of the substance.
Raman spectroscopy – Spectra acquisition

Spectra are processed using dedicated software to make them more easily interpreted. Comparison with a reference spectral database is essential for attribution of the peaks in the analysis spectrum to a specific compound.
Raman Spectroscopy - Spectra Interpretation

System assembly
Connection with computer

Definition of the points to analyze
Build on areas already analyzed with other techniques

Recording of punctual spectra
Acquisition of different spectra on the same color fields
Removal of dust and degradation material from the artefact using latex sponges.
Drying on the support of the aqueous solution with which the dust and degradation material were extracted from the sampling sponges. If measurements cannot be made directly on the asset, they are made on the aqueous extract of the sampling sponges, which are left to dry on an inert support.
spectra can be obtained non-invasively using a cell for ATR (attenuated total reflectance) measurements, and FTIR (Fourier-transform infrared spectroscopy). In this case, the experiment will be conducted, using a press (Fig. 3A) by placing the sample directly in contact with a crystal with a high refractive index (Fig. 3B), i.e. the ATR cell.
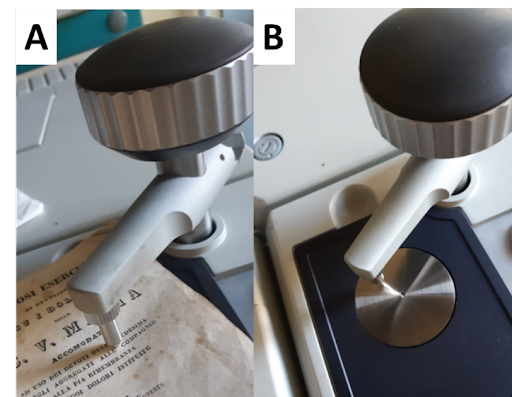
A: acquisition method; B: single reflection ATR cell
The infrared spectrum is obtained and analysed, i.e. a graph showing the intensity of the radiation absorbed by the molecules constituting the material or the intensity of transmitted light as a function of the incident radiation wave number.
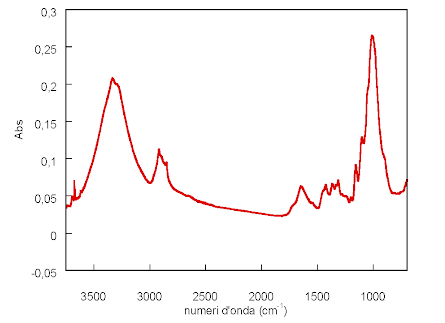
FTIR spectrum of a paper sample

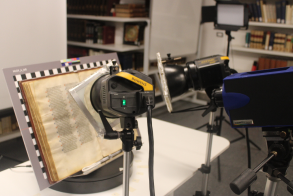
The set, defined on the basis of the dimensions of the manuscript and the area to be analysed, involves positioning the camera orthogonally to the artefact, and the two flashes, at a 45° angle to the codex. The shooting environment must be dark and there should be no external light sources. The camera is equipped with a filter, which cuts out any UV and IR radiation present, and allows only radiation in the visible spectral range to pass through, mounted on the lens. The flashes are also equipped with filters that only let UV radiation through.
Acquiring UVL images on a manuscript
Acquisition consists of recording an image of the fluorescence of materials in the visible spectral range when illuminated by a high-energy flash with ultraviolet radiation.
example of a UVL image on a manuscript
UVL images must be processed manually using image processing software (e.g. Photoshop). What is obtained is an image of the manuscript sheet(s), where materials with characteristic fluorescence emissions are highlighted.
example of a UVL image on a manuscript

- Filtered flashes
- Artifact
- Camera with filtered lens
- Focus
- Flash shooting and activation
- Image recording
- Recorded image processing
In the laboratory, acquisition points are planned on a reproduction of the image. The application of the technique on the De Balneis Puteolanis codex involved both the parchment, the miniatures and the ink. The objective was to obtain information for the recognition of the pigments and the execution technique of the portions of the backgrounds where the metal foil is present.
Portable instrumentation makes it possible to analyse artefacts directly in situ, i.e., at the place where they are stored, without altering their state of preservation or moving them when they are movable items.
If the system is appropriately flushed with helium gas, it is possible to extend the range of detectable elements up to sodium (Na, atomic number Z = 11) and uranium (U, Z = 92), otherwise lighter elements such as sodium, magnesium and aluminium will not be detectable.
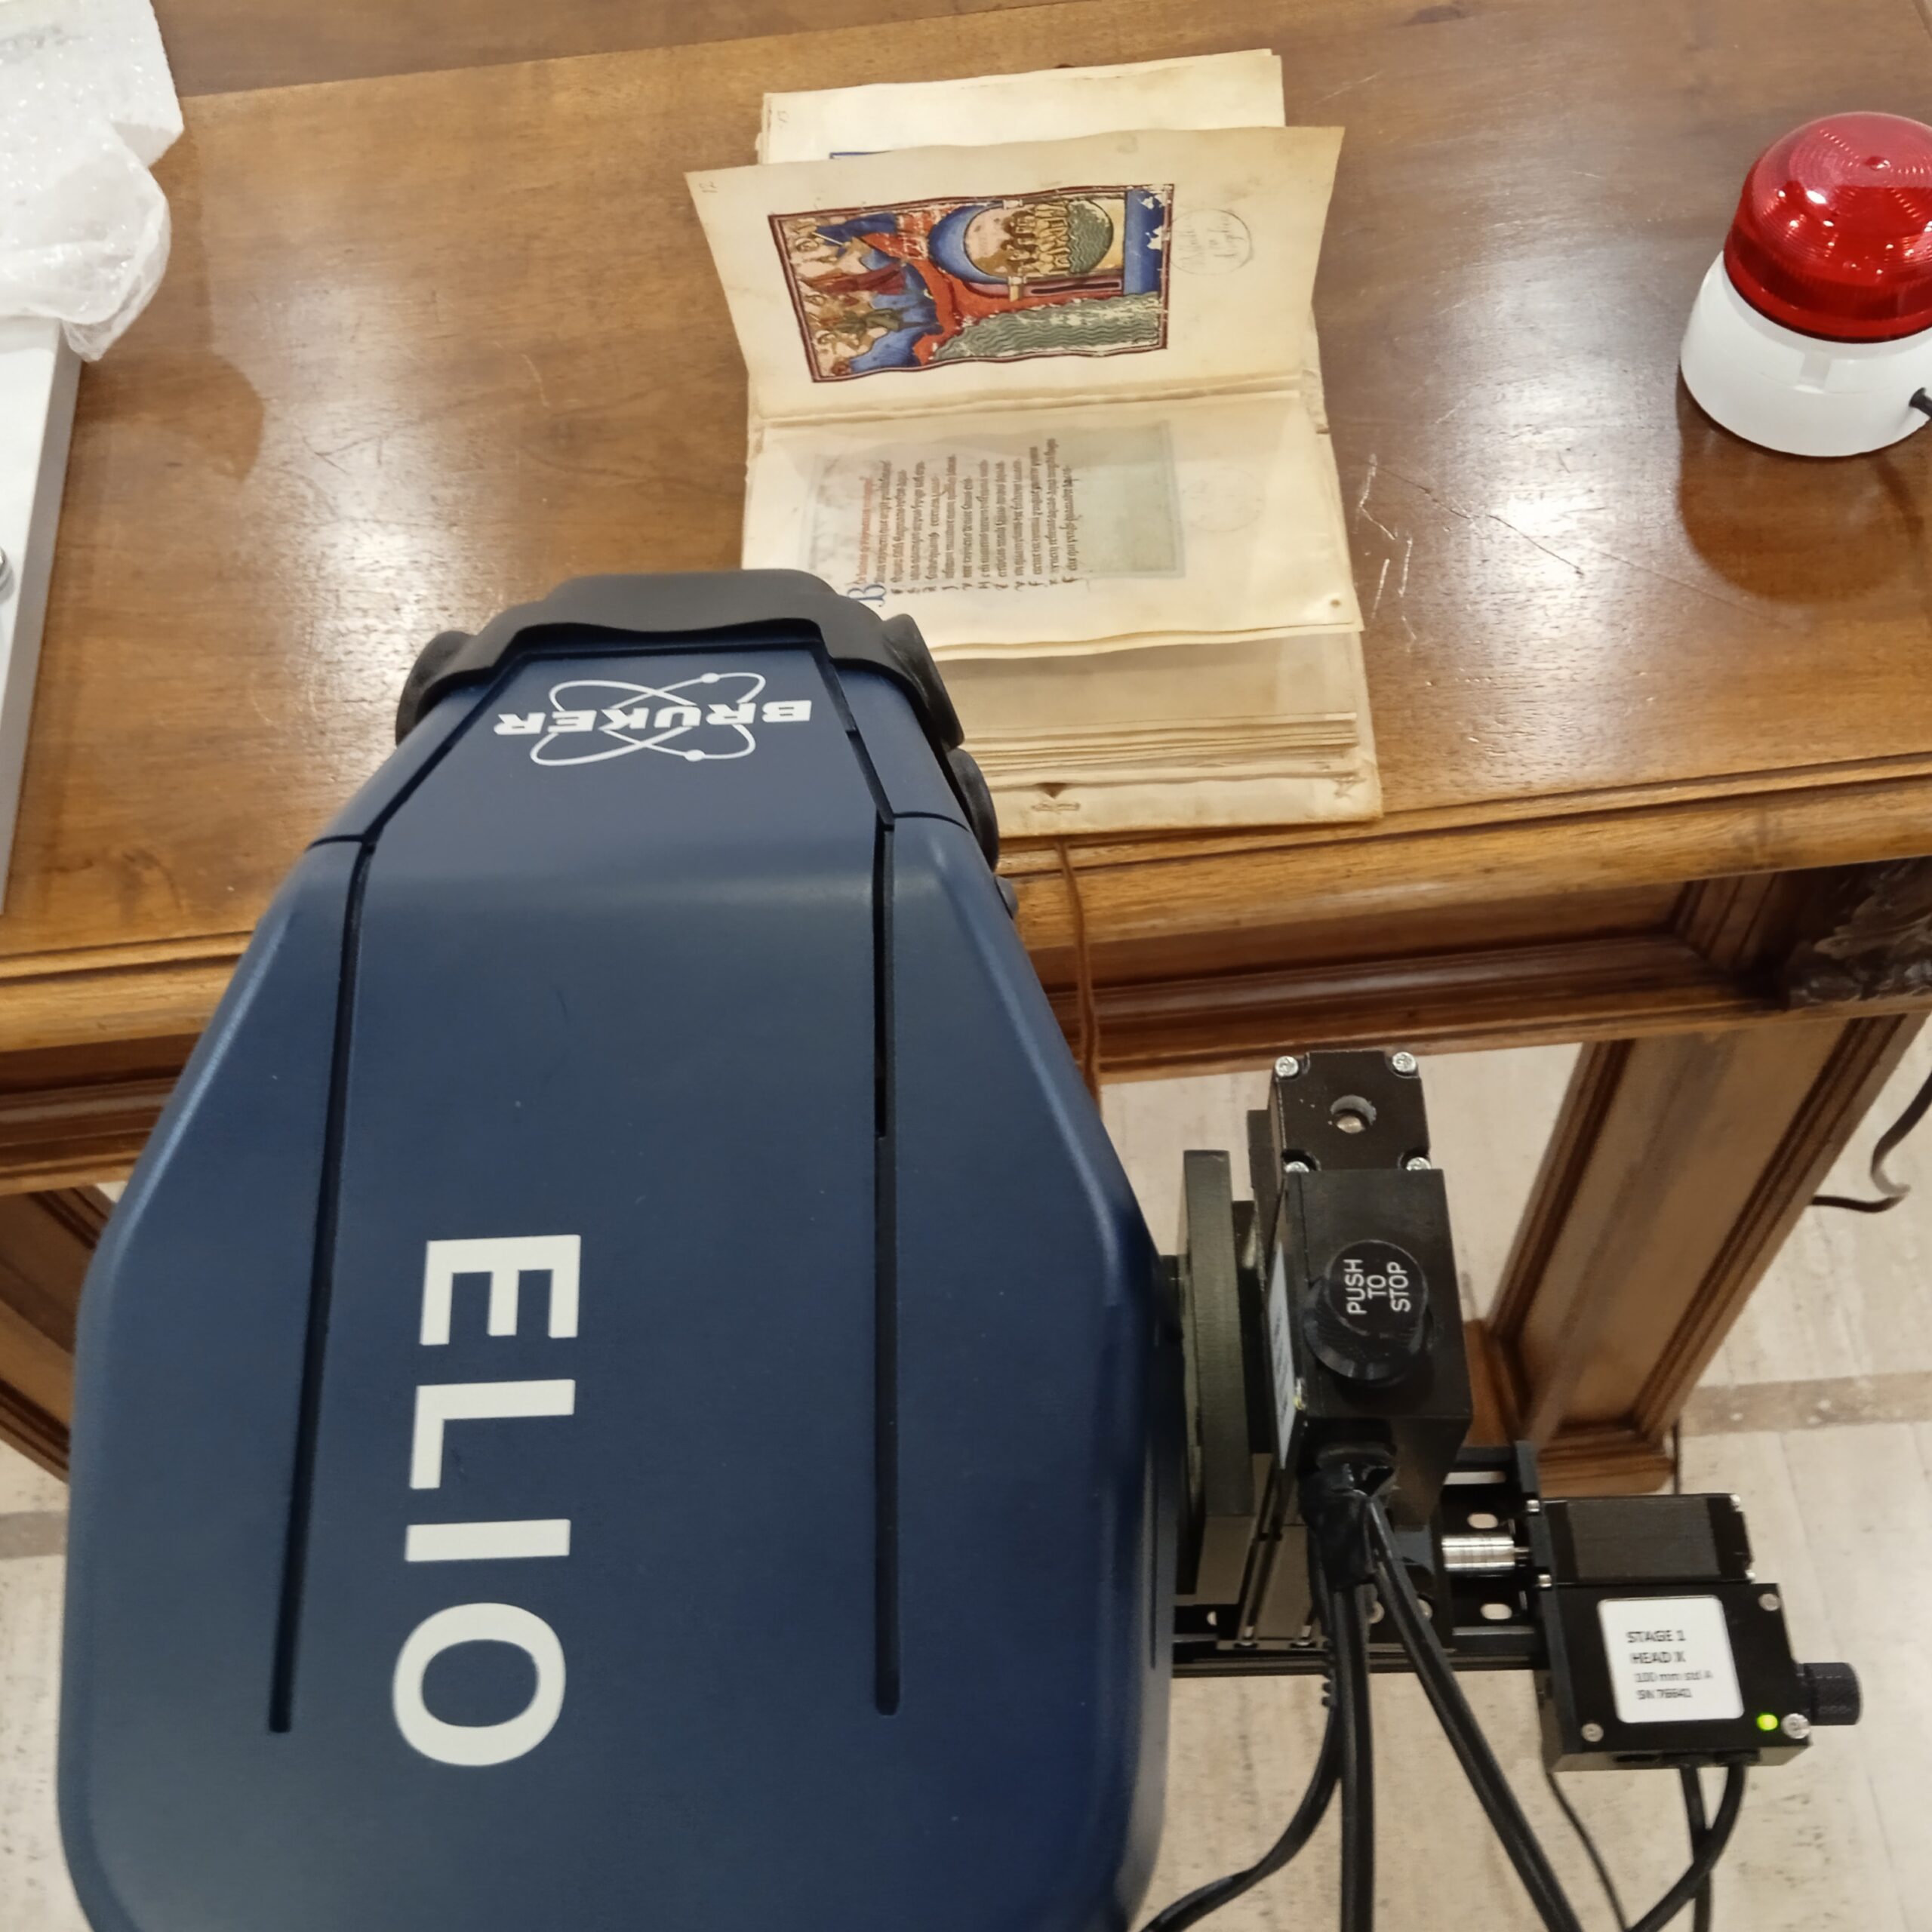
The X-ray fluorescence spectrum generated by the system shows the number of counts emitted by the material under investigation as a function of the energy used. The peaks in the spectrum are specific to each chemical element. The Elio dedicated Esprit Reveal software supports the reprocessing of the acquired spectra and maps.
In the laboratory, the spectra and maps are analysed and compared with data from other methods.
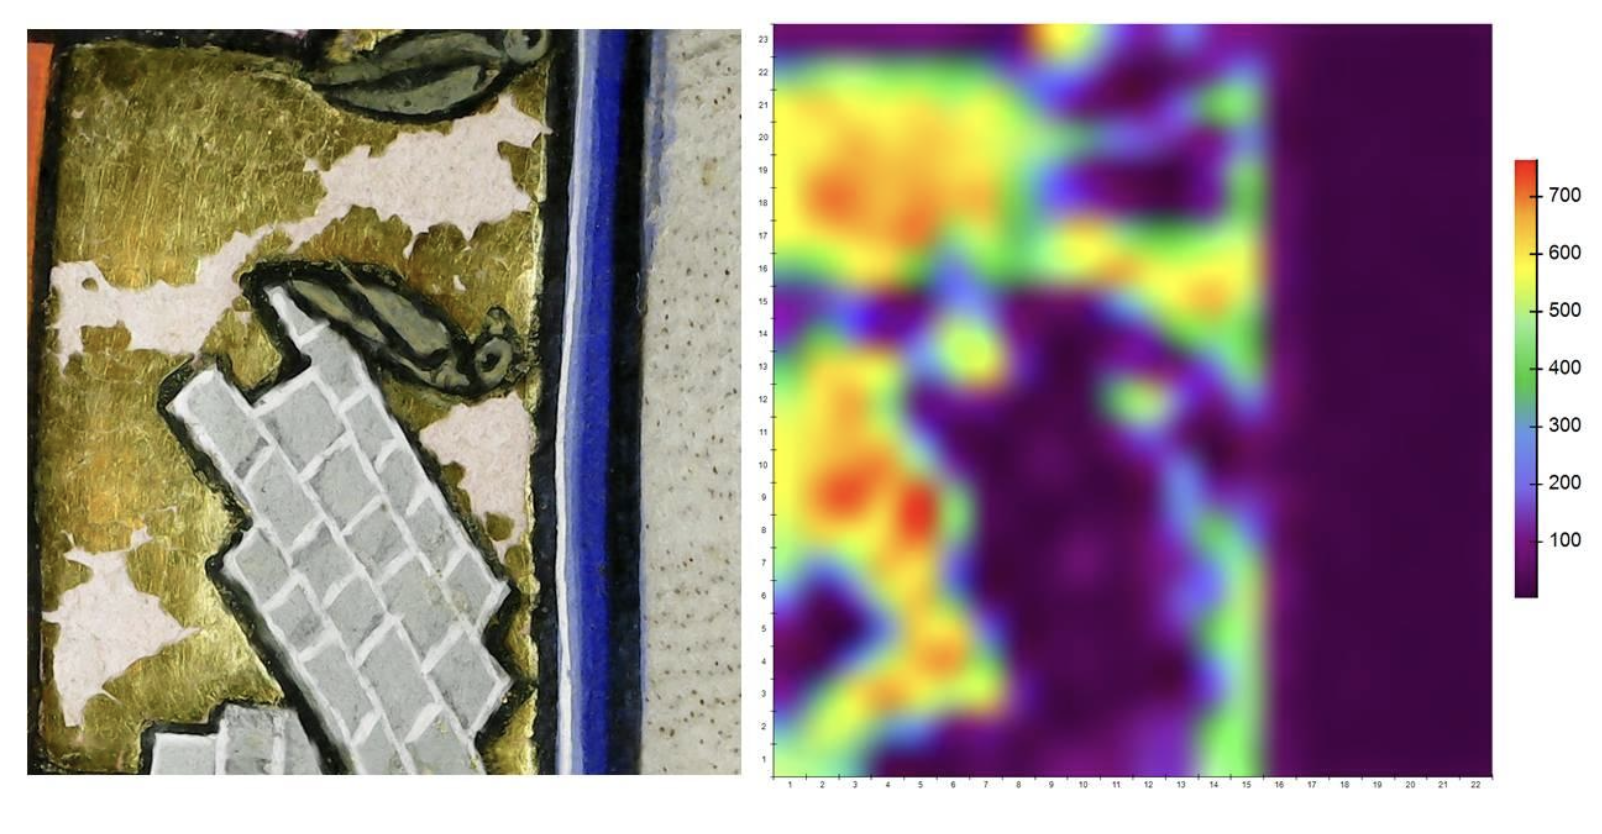
On the left is the image of a detail of the parchment in correspondence with gaps in the metal decoration. On the right an Au element distribution map.

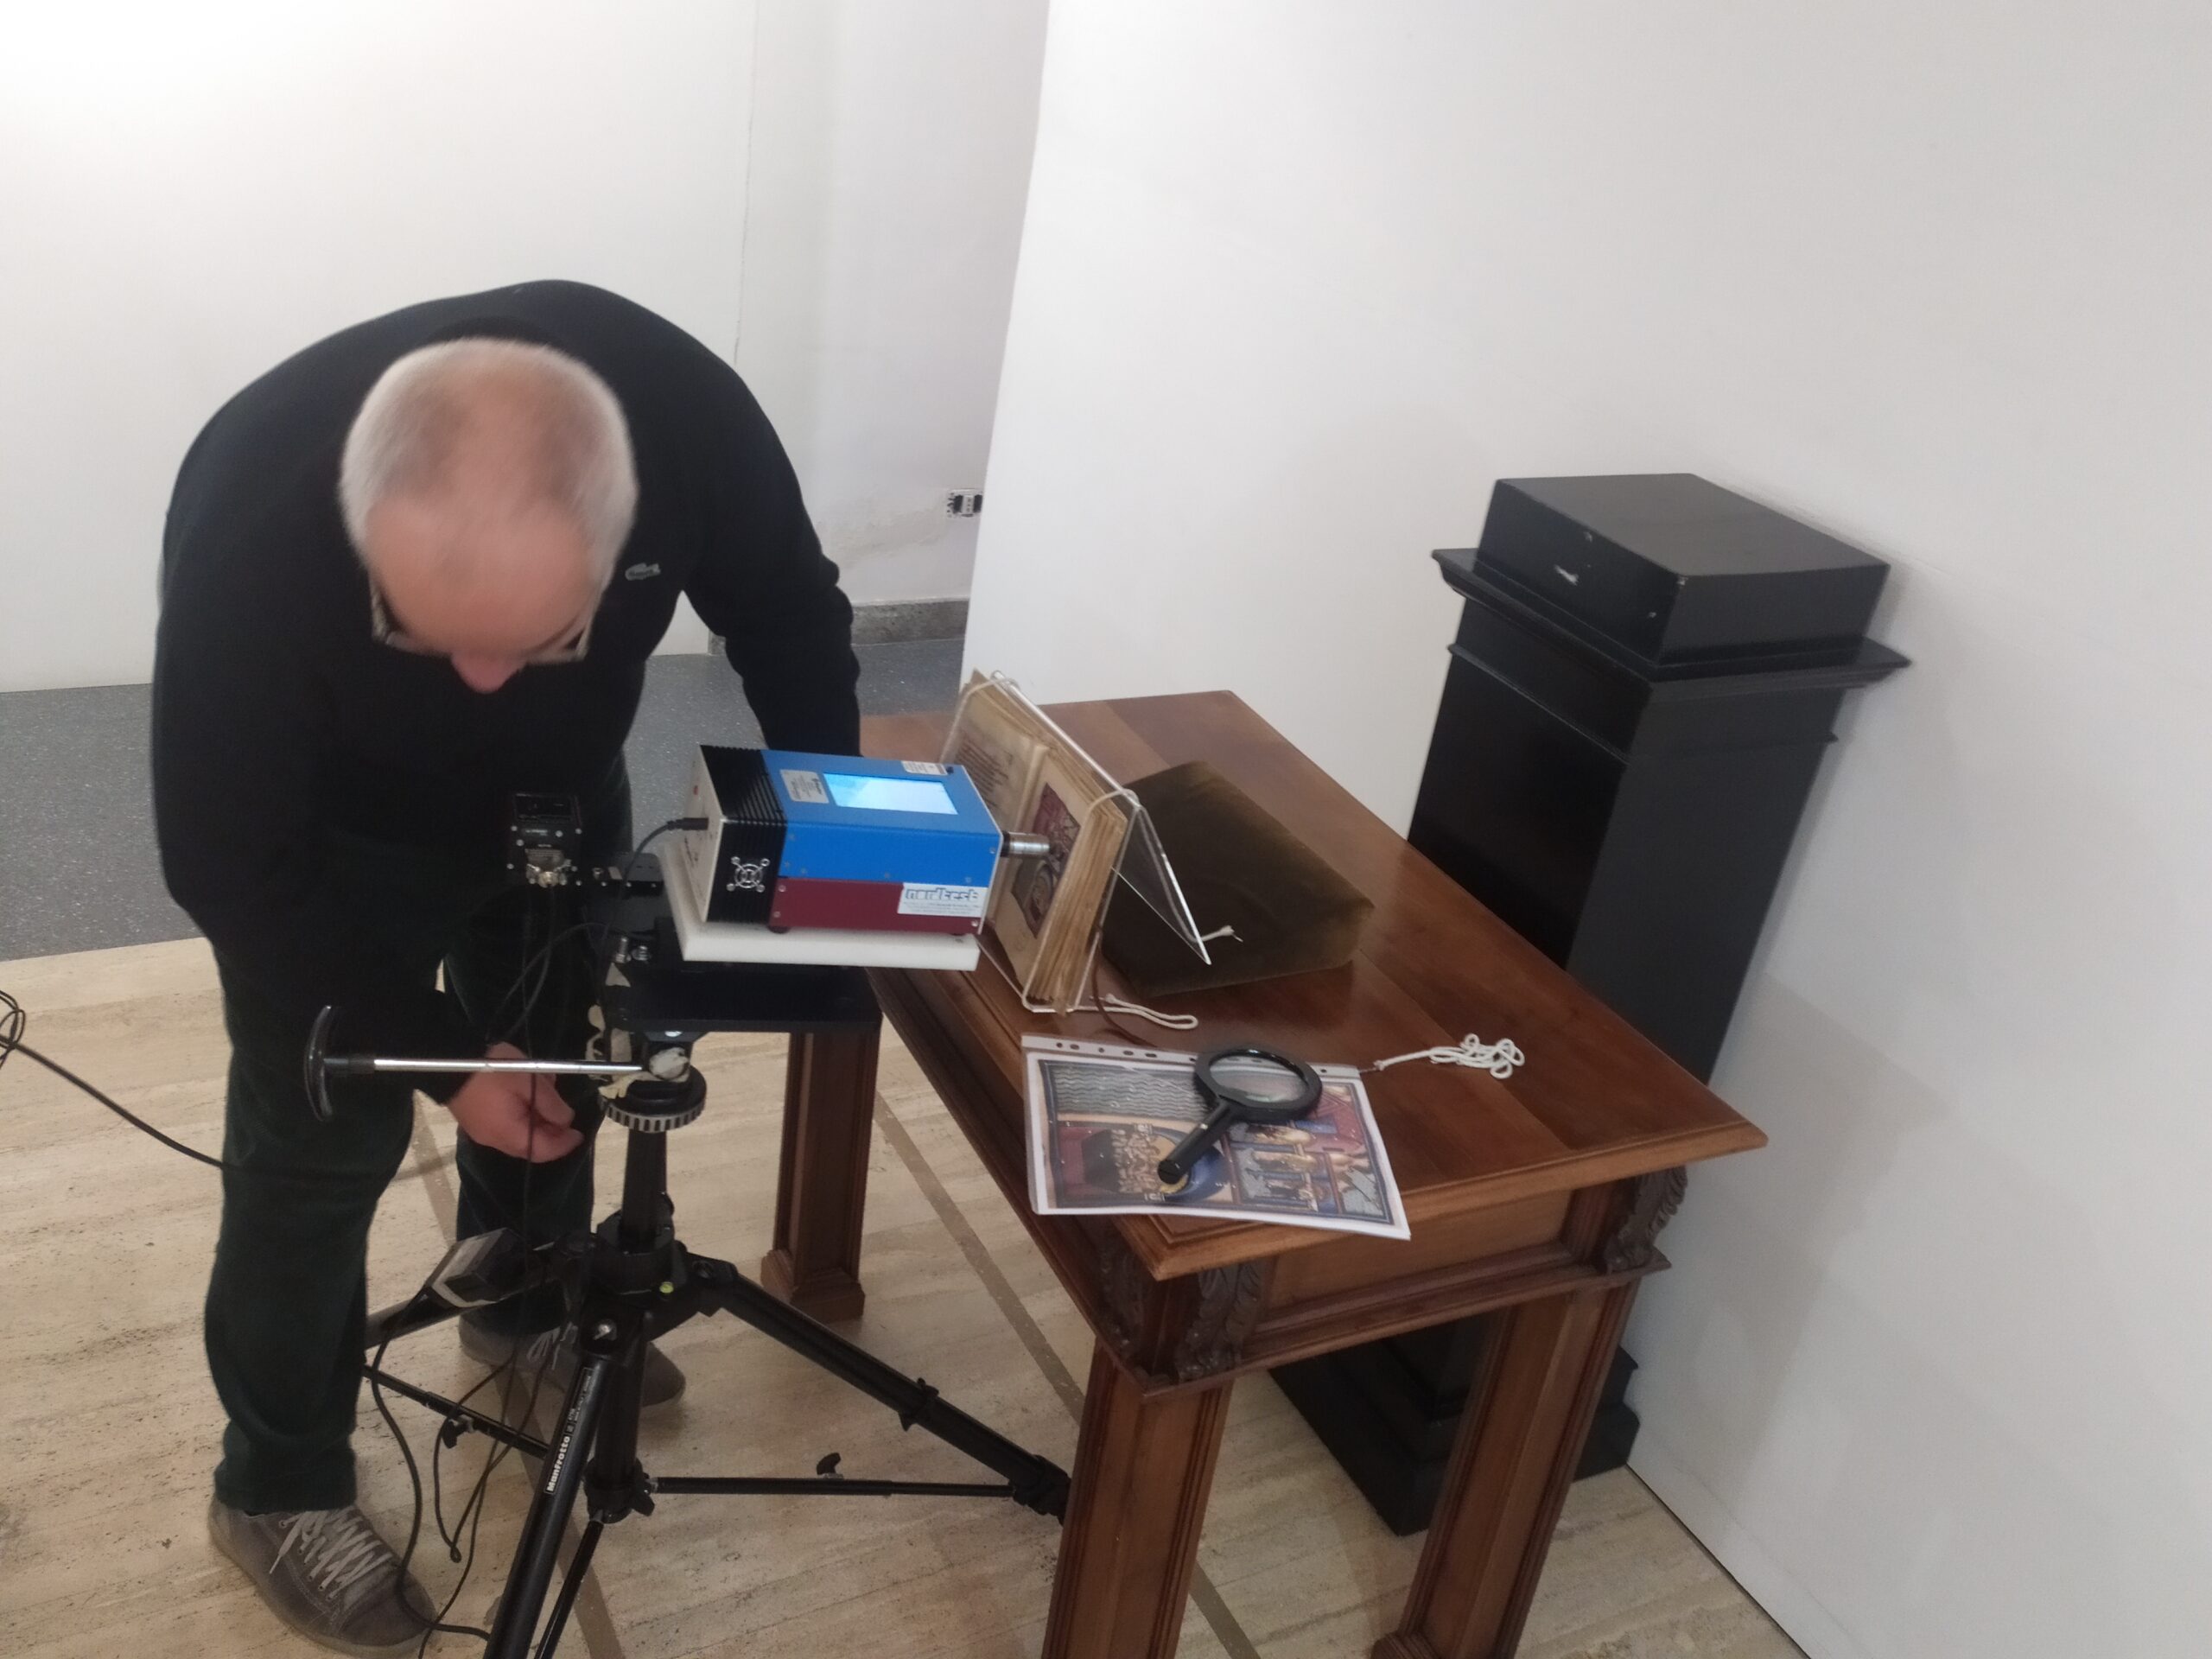
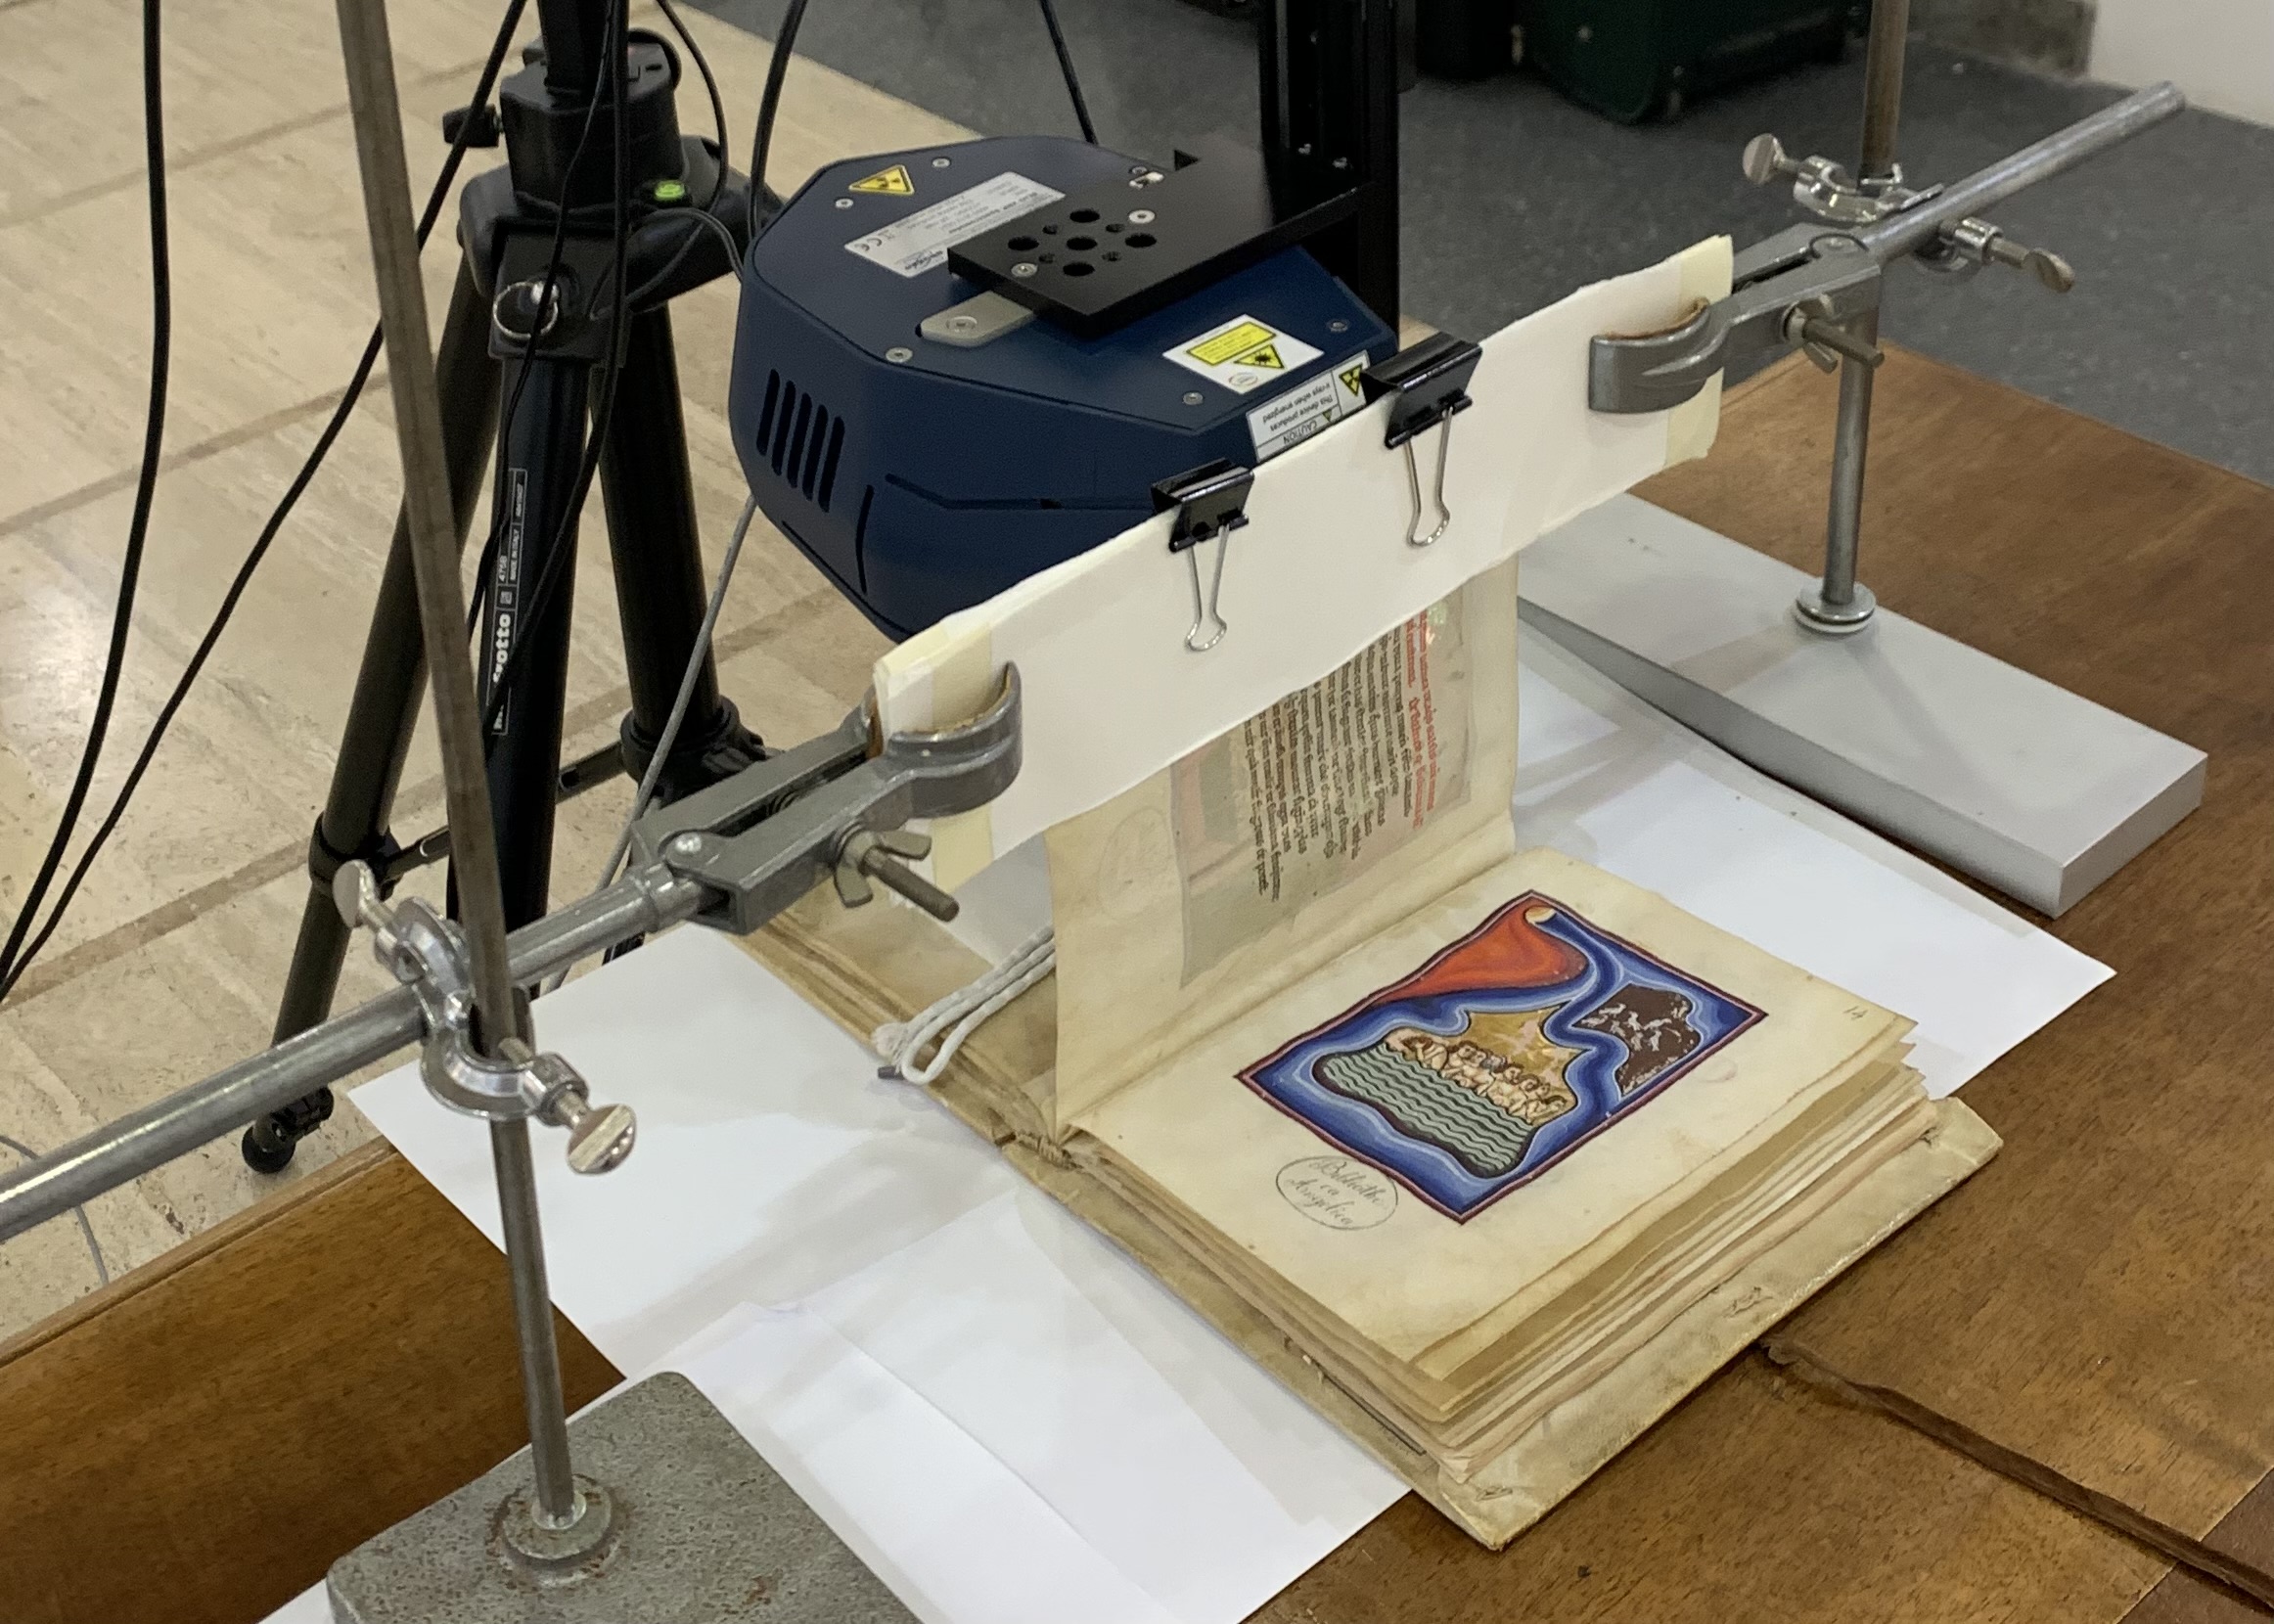
The set, defined on the basis of the size of the manuscript and the area to be analysed, involves positioning the artefact, the IR camera and the flash lamps at a 45° angle to the codex.
Pulsed thermography – Acquisition system
In the configuration called pulsed thermography, the acquisition consists of the recording of a sequence of thermograms, during which the flashes are activated to heat the artefact. The IR radiation, which is emitted once again, is then recorded by the IR camera, which provides a sequence of temperature maps, called thermograms.
Pulsed thermography – Acquisition system
Extraction of thermograms from the recorded sequences stratigraphically describe the codex. The heating generates a process of heat diffusion in the codex’s volume, which is uniform through a homogeneous material. In correspondence with non-uniform elements, which hinder the diffusion of heat, areas of different temperature are generated at the surface, which reproduce the contour of these elements in the thermogram.
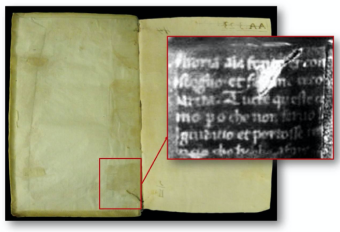
Front cover of a codex preserved at the Angelica Library in Rome. The thermogram corresponding to the area highlighted by the red box shows a fragment of reused writing used as a ligature reinforcement flap.

- Flash
- Artifact
- IR camera
Positioning the MWIR sources, the artefact and the IR camera. Once the codex view has been selected, generally corresponding to the view chosen for thermographic acquisition, the MWIR sources are positioned after finding the angle that minimises reflection phenomena.
Pulsed thermography - Acquisition system
While illuminating the codex, the reflectogram is simultaneously recorded using the same IR camera used for thermographic acquisitions. This operation can be repeated several times, varying the illumination angle, to highlight different elements.
Reflectogram recording that shows the radiation component reflected locally from the surface of the artefact in response to the illumination of the codex. This operation makes it possible to highlight hidden elements.
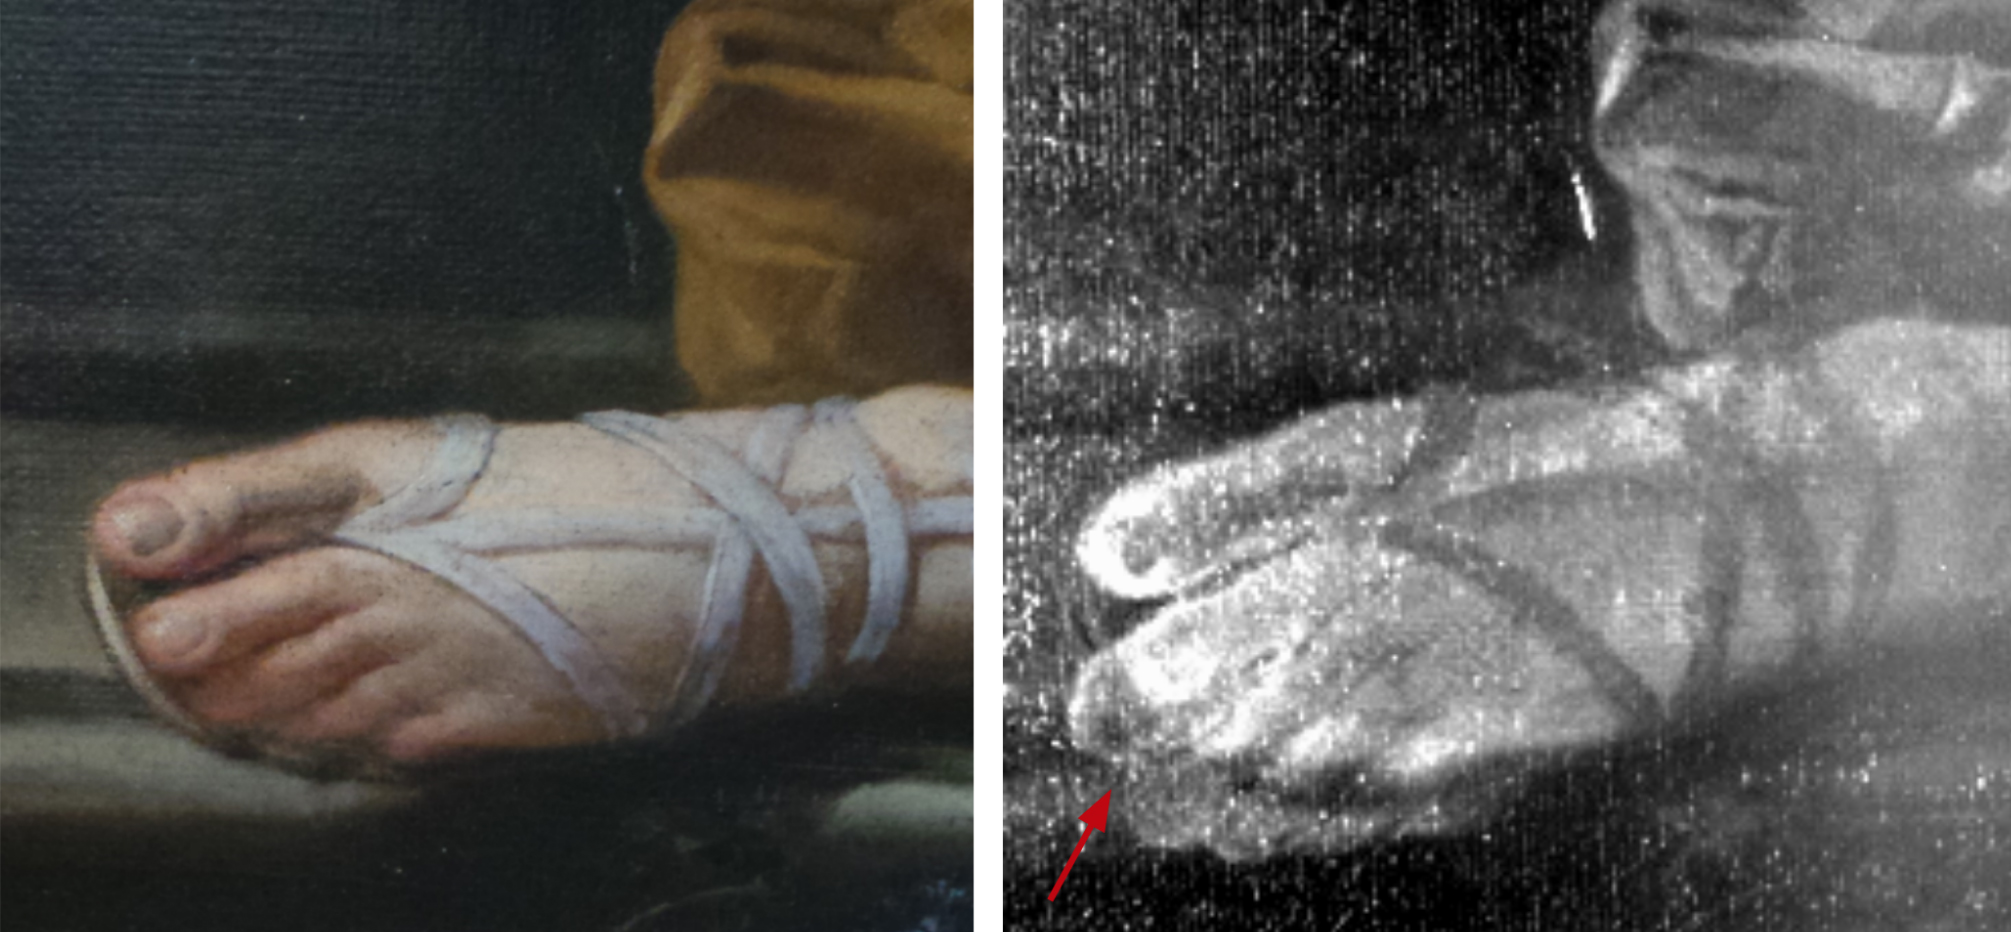
Filippo Lauri and Mario Nuzzi, La Primavera, 1659, oil on canvas, Palazzo Chigi, Ariccia, in which the reflectogram (right) shows a pentimento, at the foot, not visible in the photograph on the left
The reflectograms are processed to minimise artefacts and increase the legibility and contrast of the elements of interest. Then, the information collected is interpreted and compared with thermographic images recorded at the same distances and angles.
Software used for processing reflectographic images

- Positioning:
- Sources
- Artifact
- IR camera
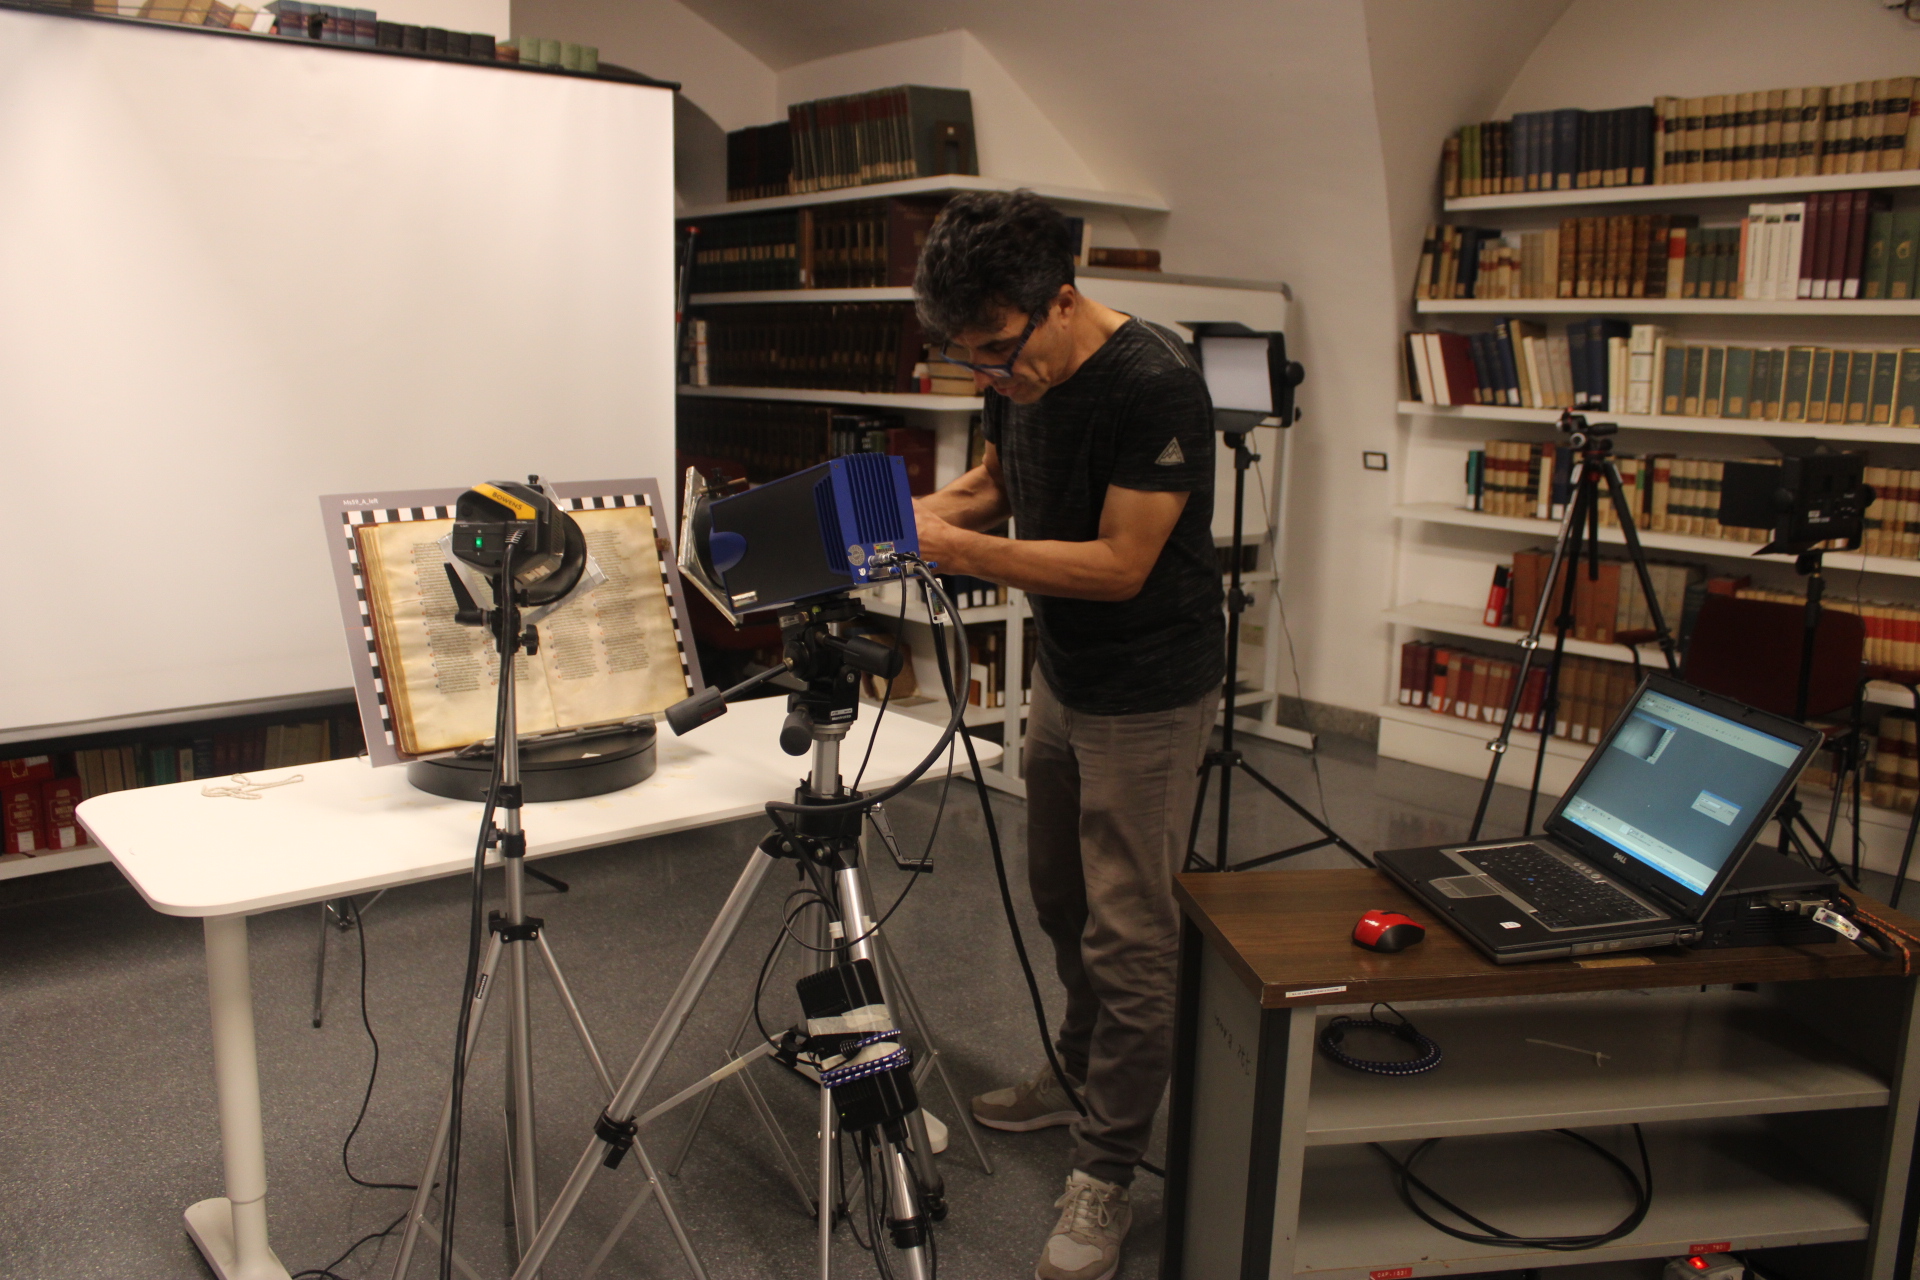
Since the photographic camera and the thermal imaging camera have very different optical systems and resolutions, the acquisition set was specifically designed to ensure maximum correspondence with the perspective as well as overlap between the RGB and IR datasets so they could be integrated into a single model.
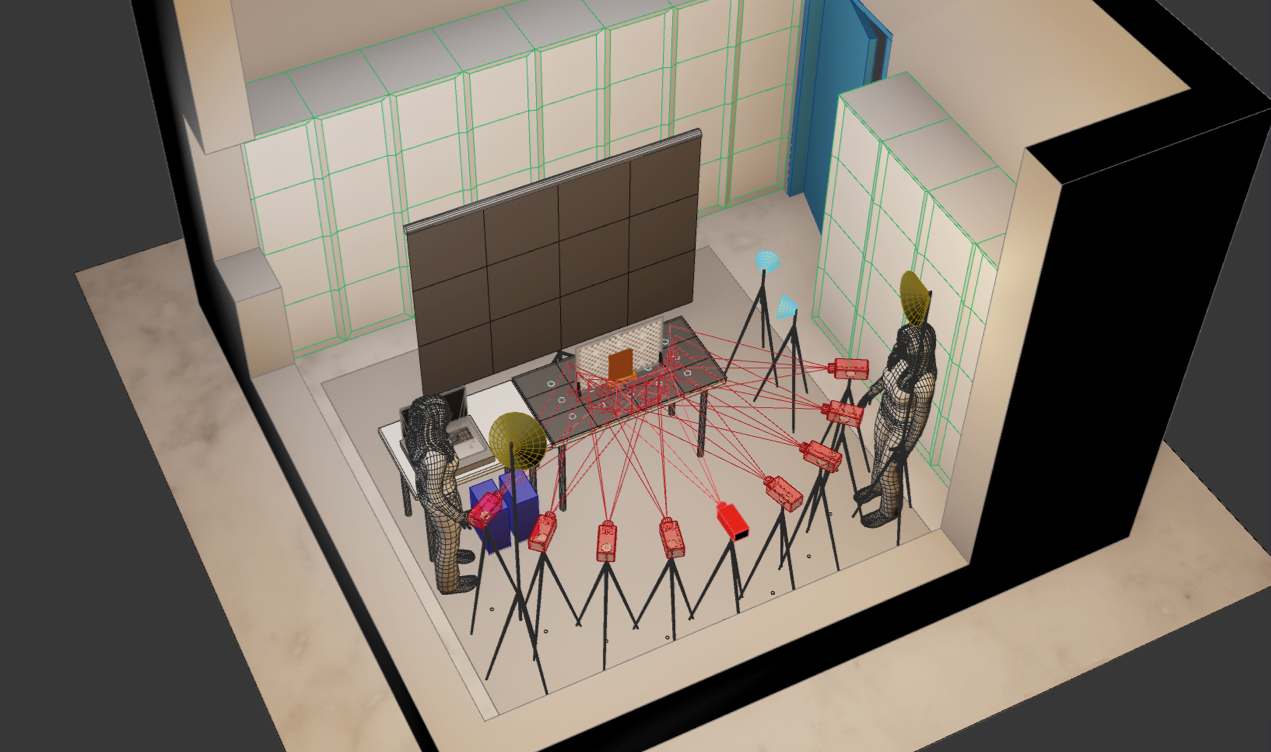
Design and simulation of compatible acquisition set for the photographic camera and thermal camera
A panel, with automatic recognition and equipped with a grid with metric references and targets, was designed to be positioned around the codex during acquisition, so that the same metric reference system could be applied to the RGB and IR images.
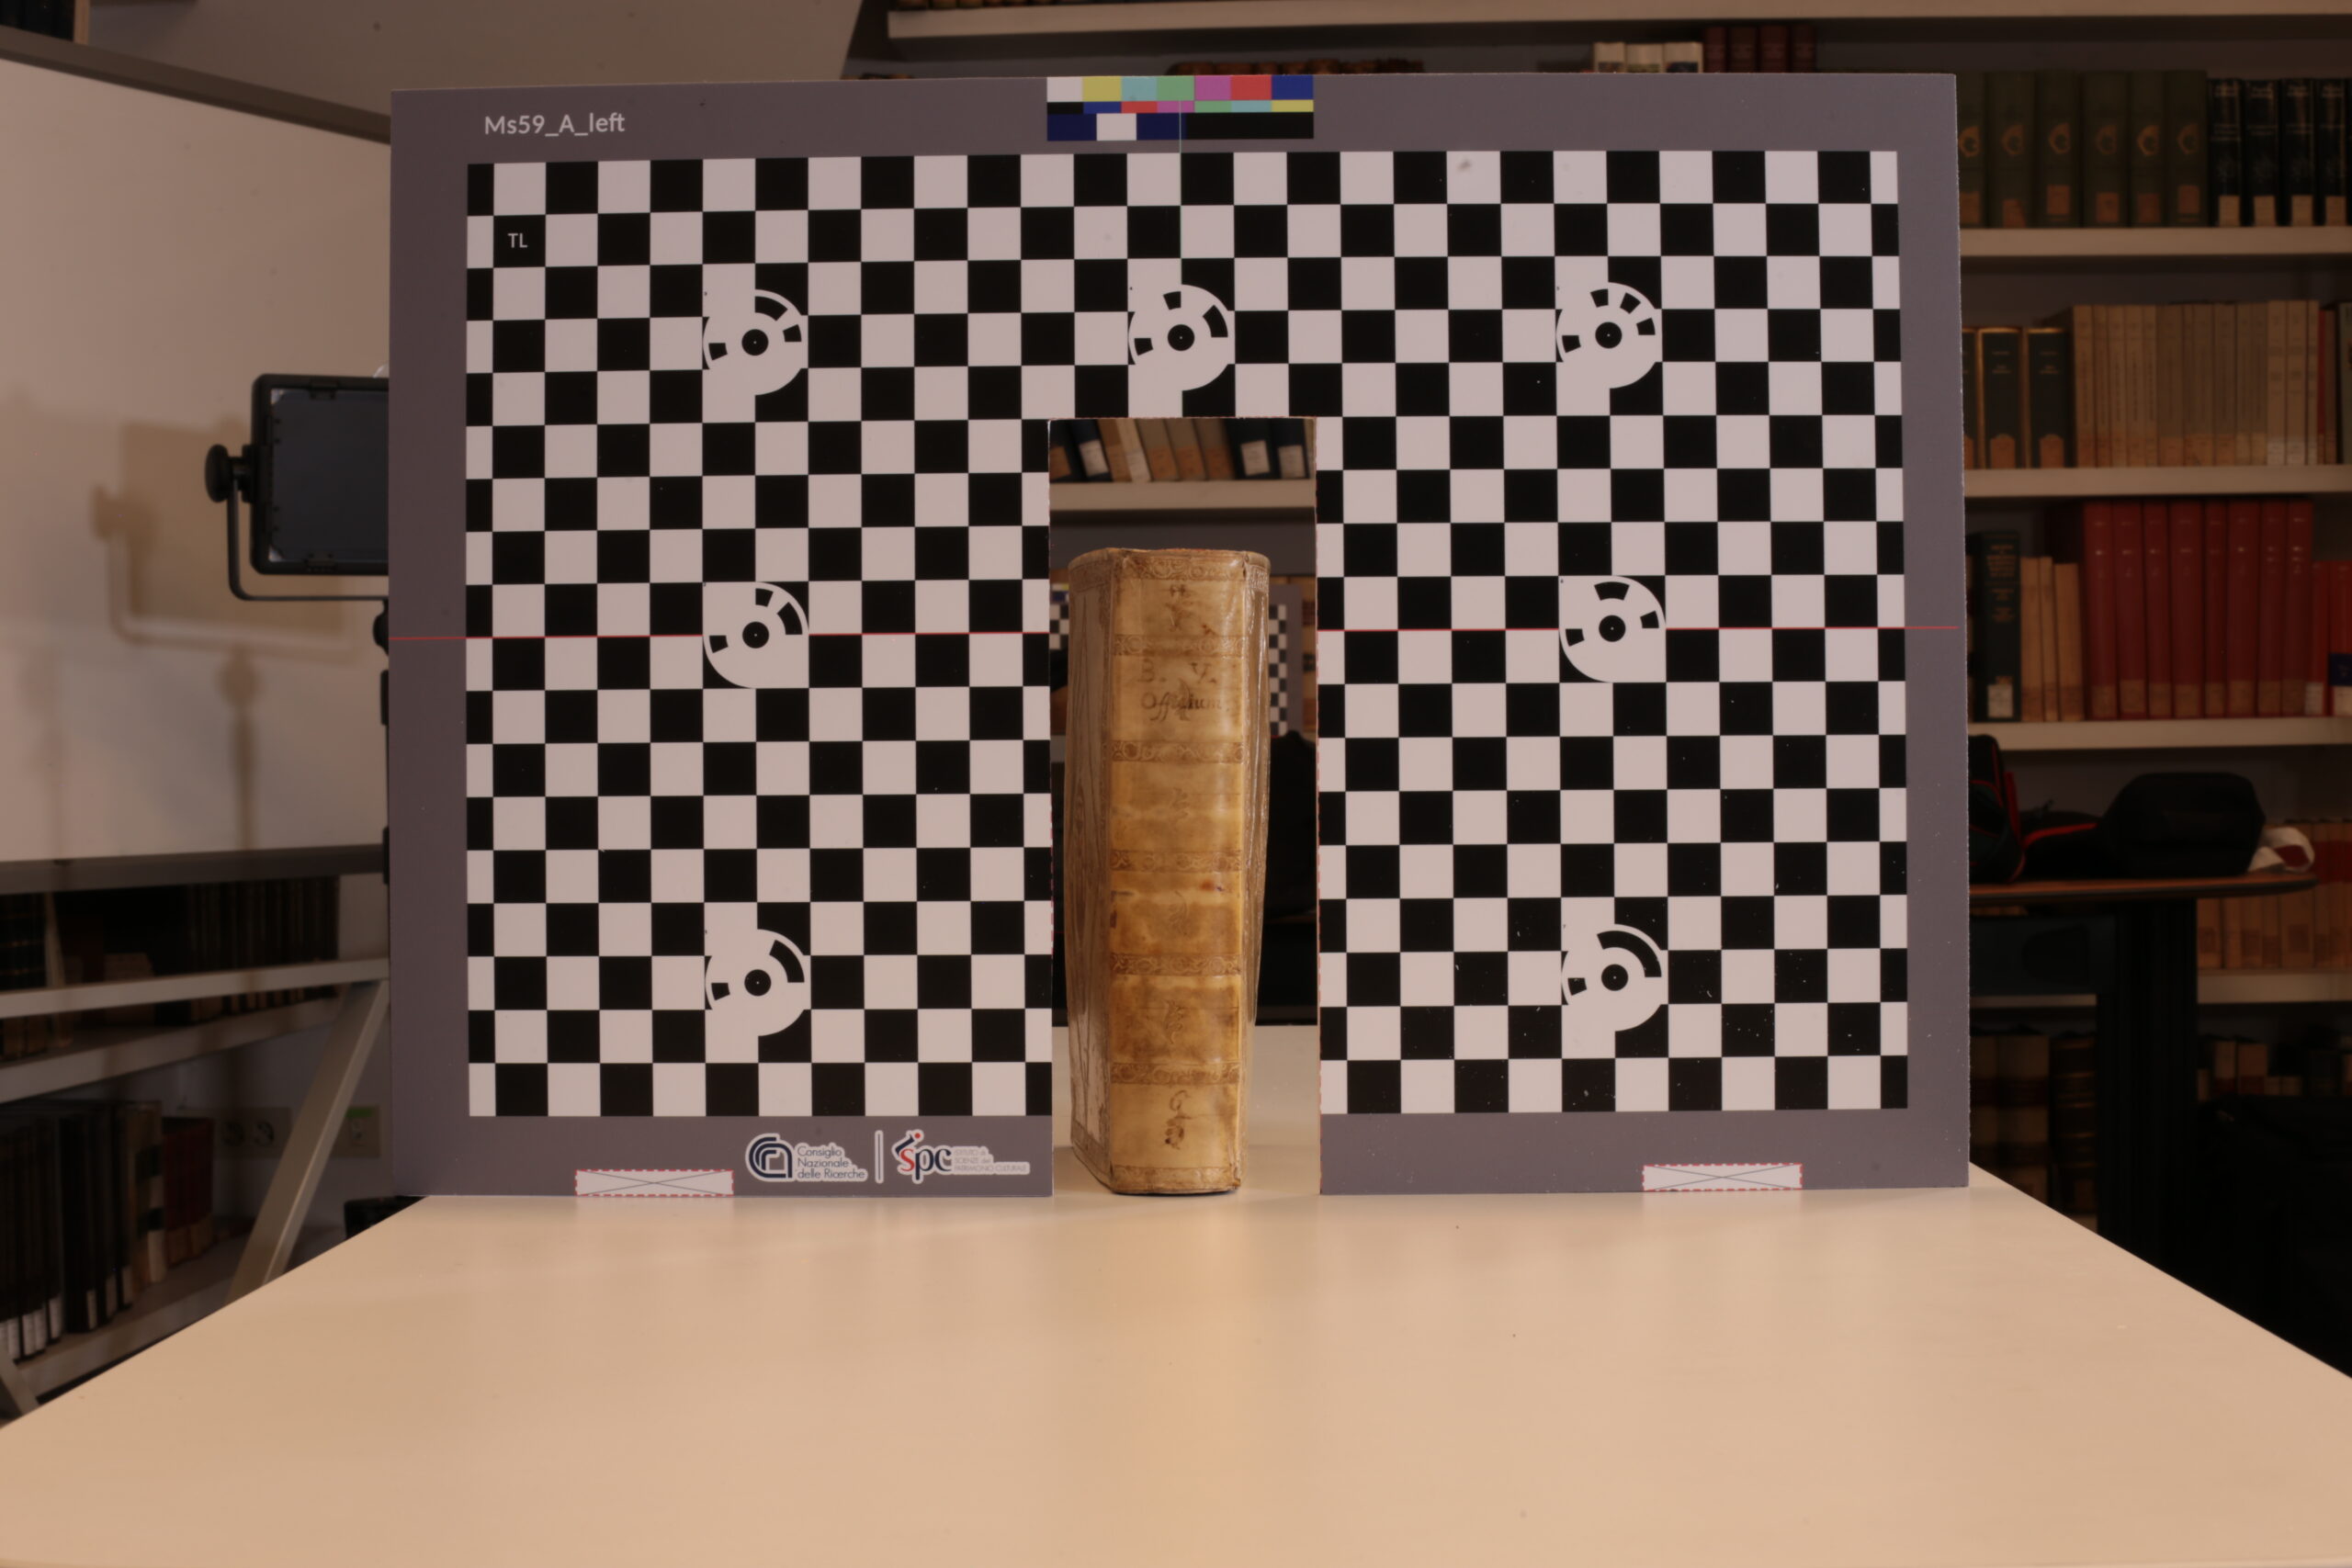
Calibrator panel design
In situ survey with a photographic instrument.
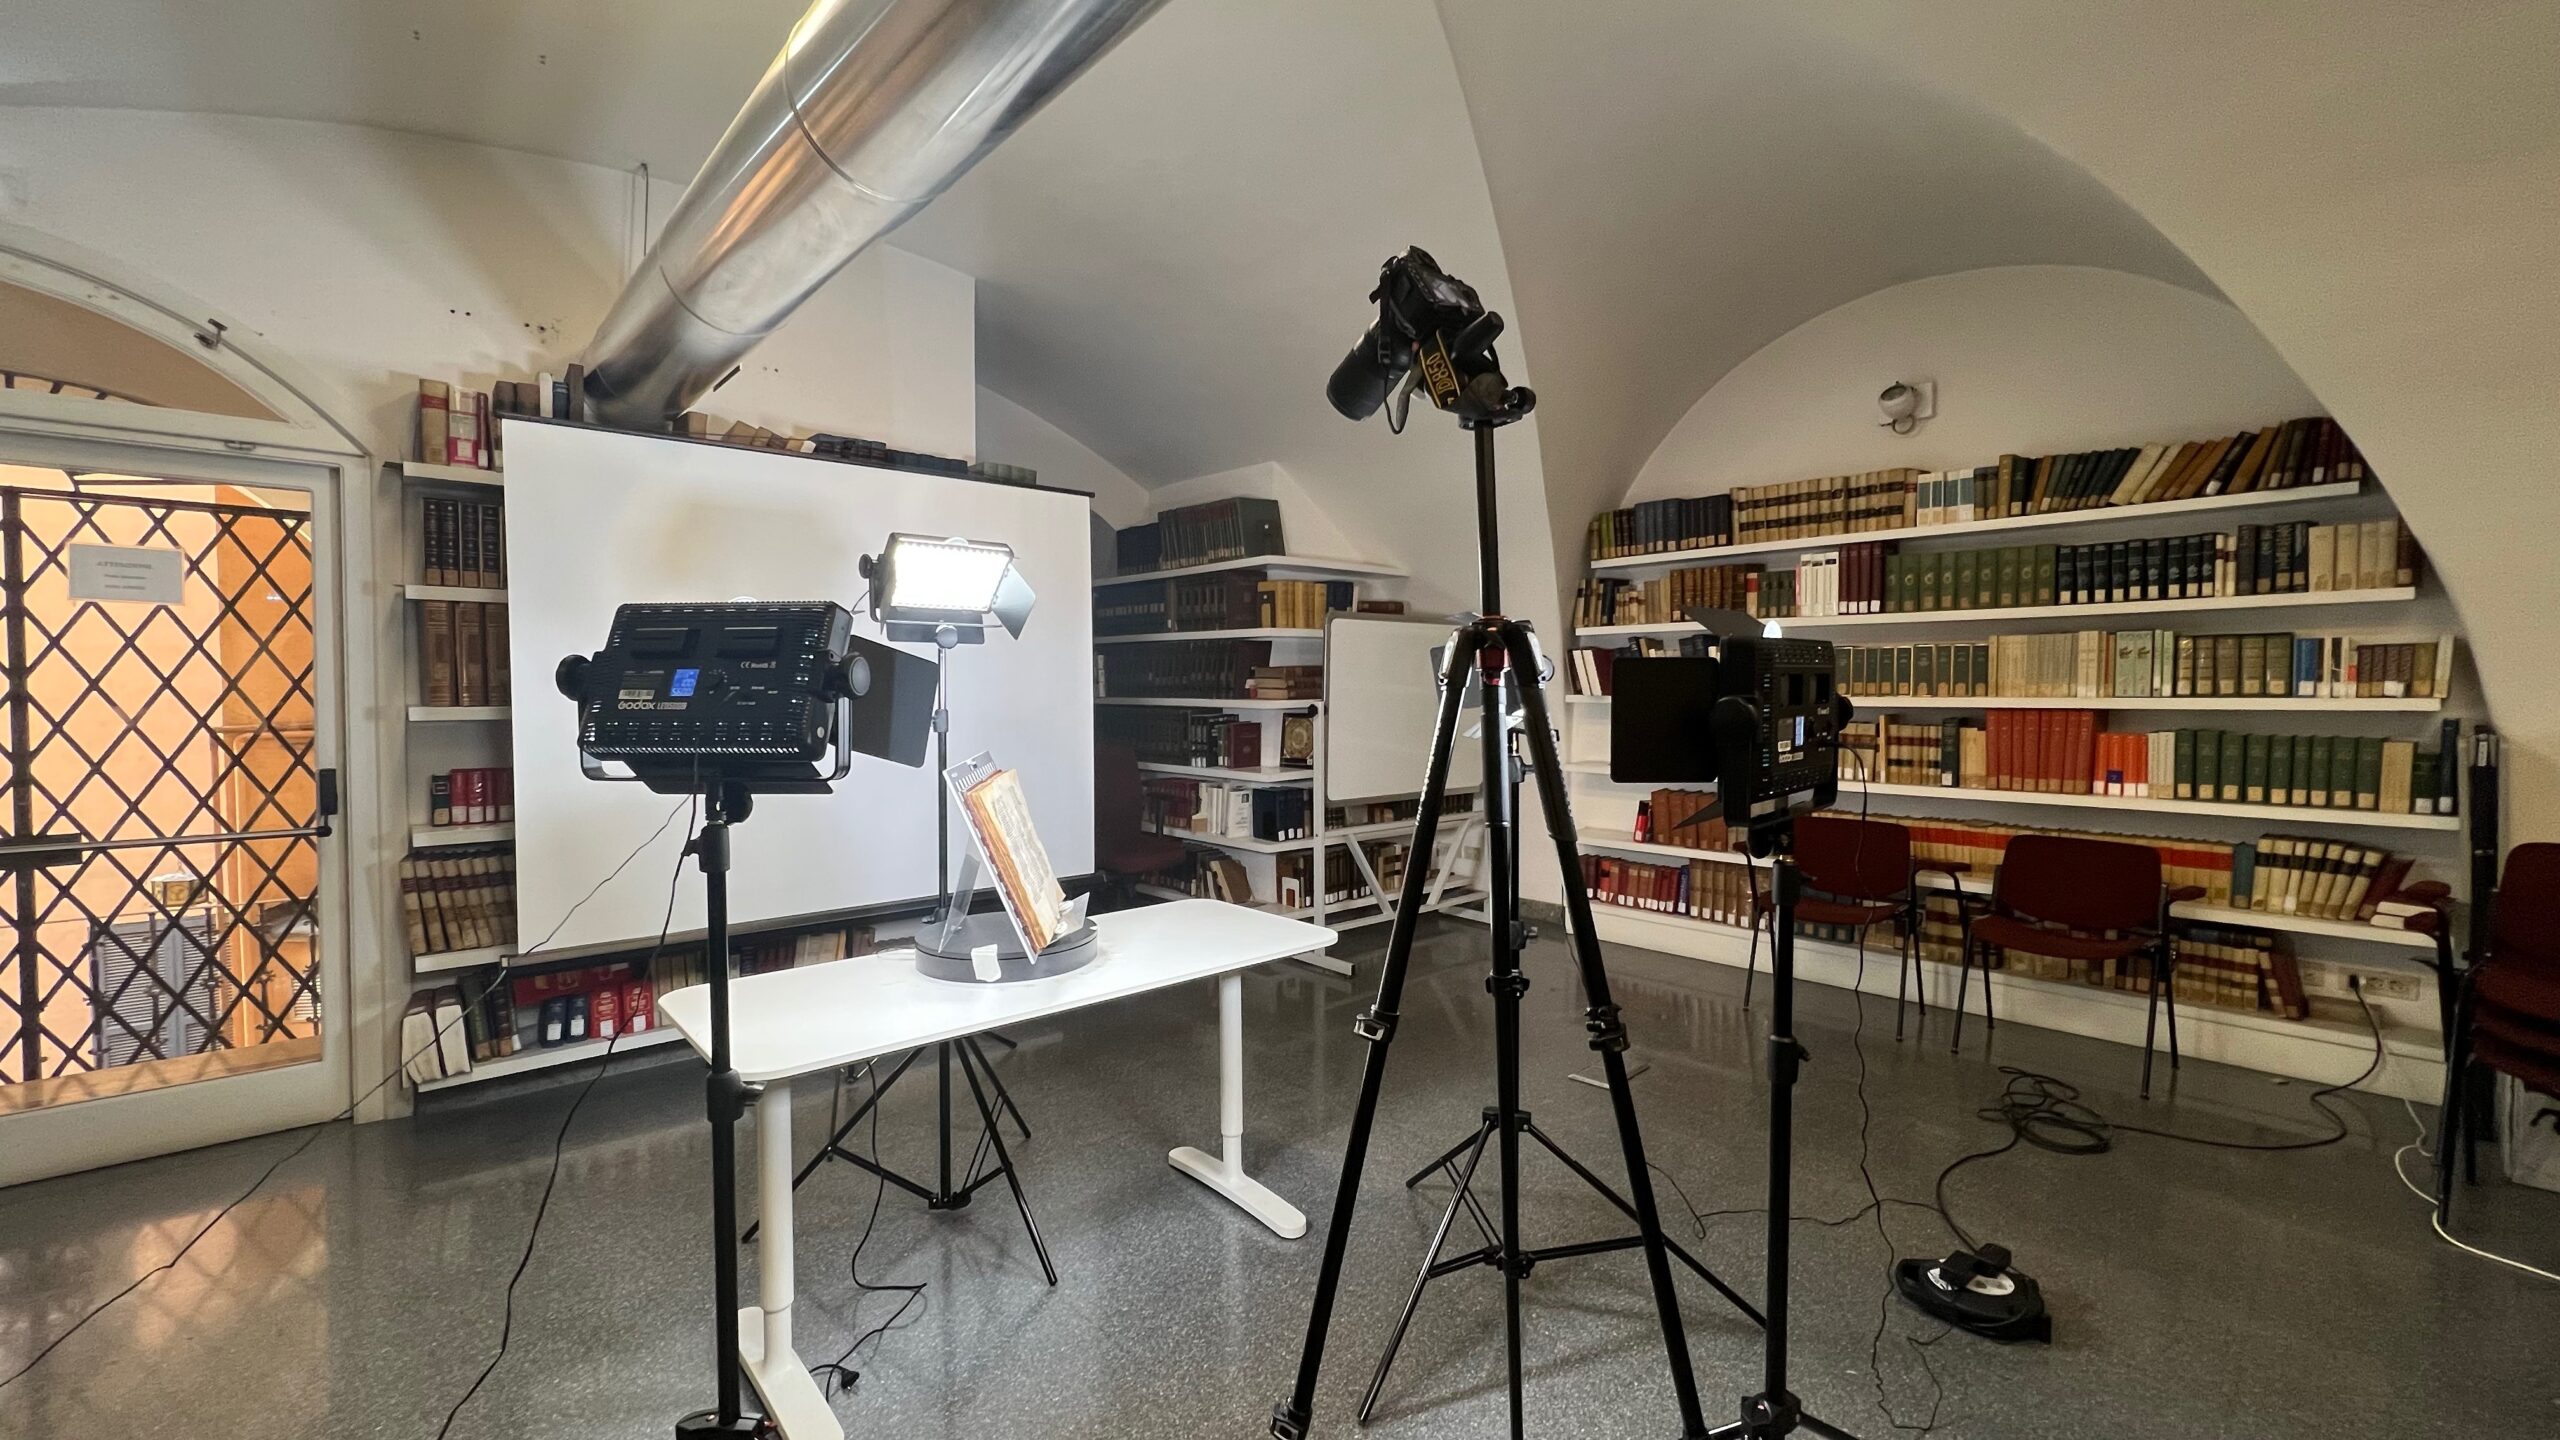
Photographic acquisition of the artefact according to the prearranged scheme
Reconstruction of the photogrammetric model through camera orientation and creation of a point cloud with an .xyz file and RGB spatial information.
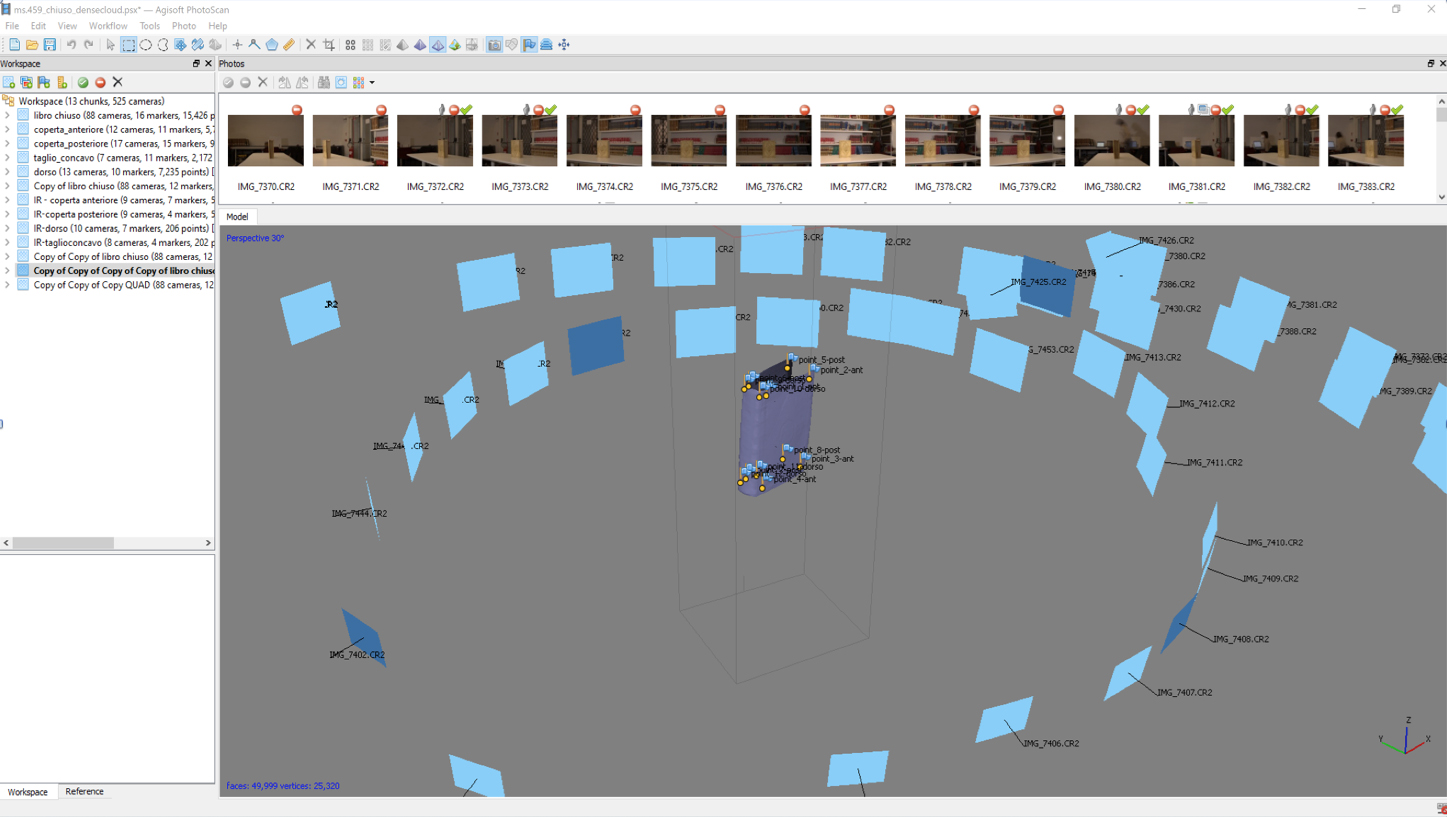
Calculation of camera orientation and photogrammetric restitution
Extraction of a polygonal solid model and optimisation of the topology in computer graphics. Finally, creation of the photographic texture for photorealistic rendering.
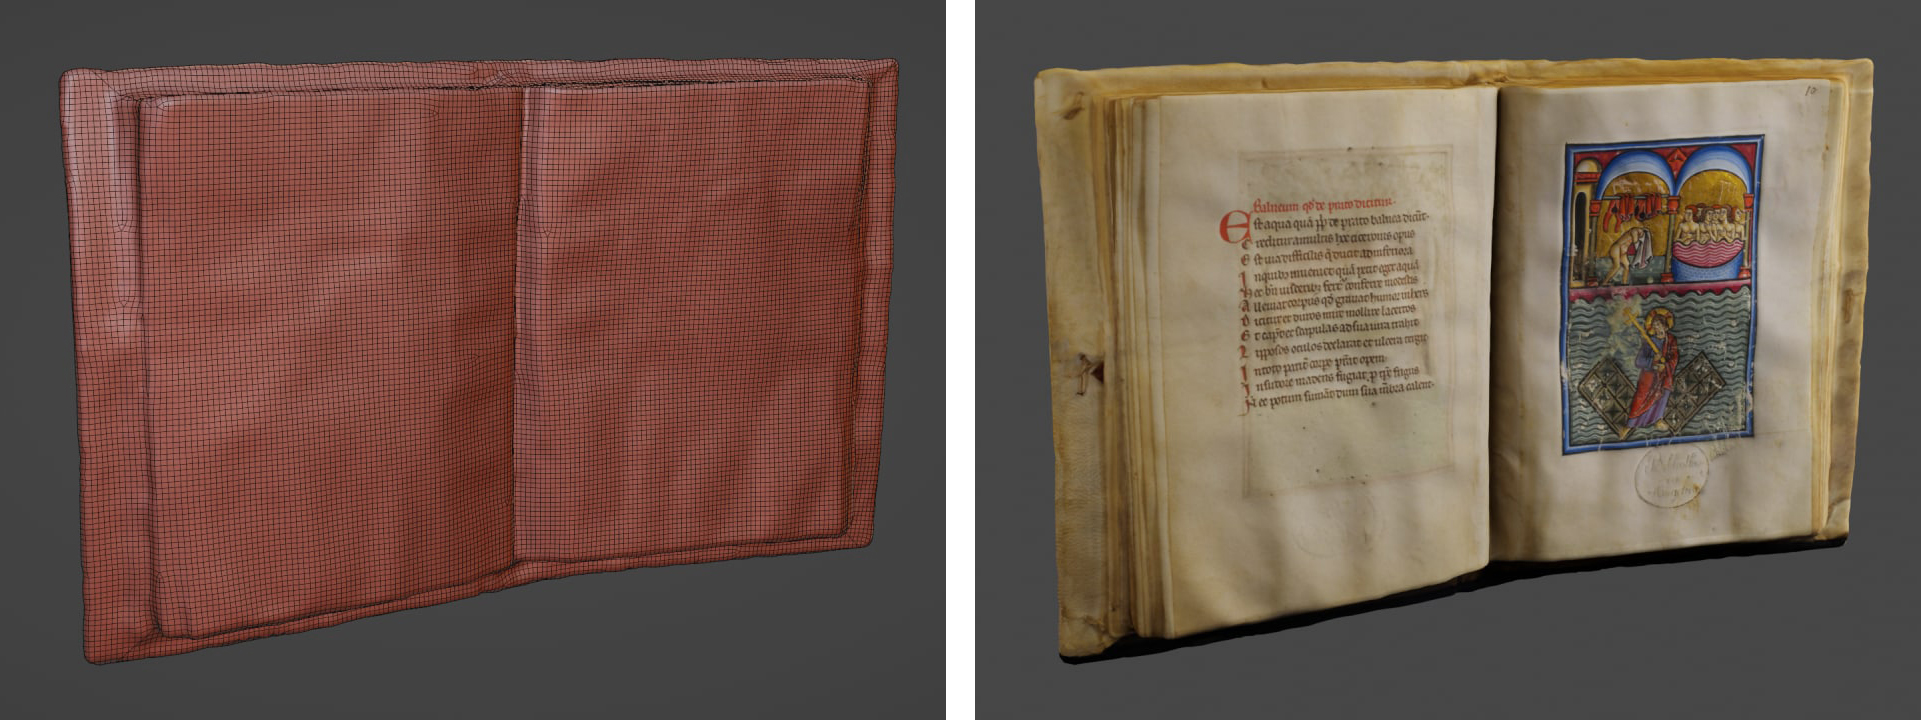
3D model after the post-processing phase
Emphasising the resolution of the IR images with Gigapixel AI to orientate the IR images in the 3D space.
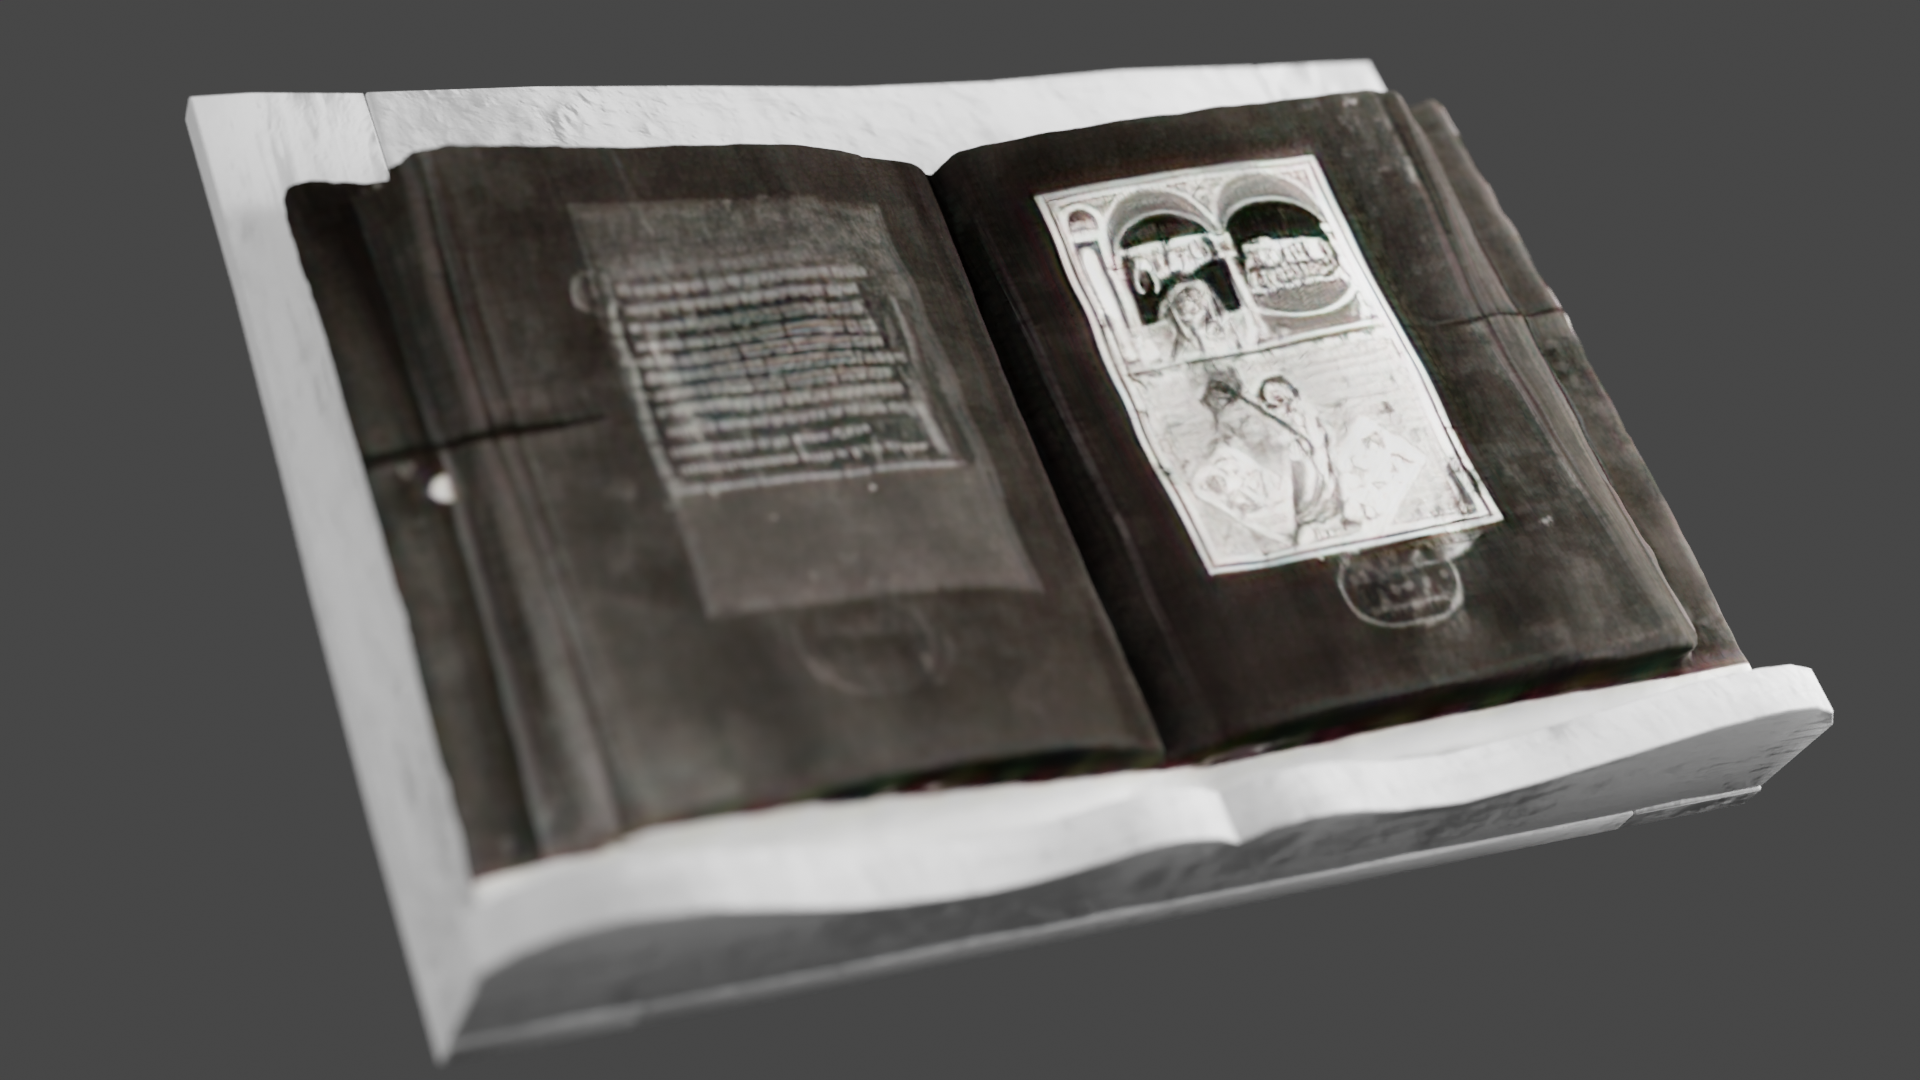
3D model consistently mapped with RGB textures and IR thermograms acquired in the various stratigraphic layers

- Positioning:
- Artifact
- Calibrator panel
- Lights
- Cameras and IR Camera
Collecting samples of the micro-organisms present on the document using simple contact with sterile swabs or use of fragments already detached or removed from the document during restoration and that could not be relocated.
Sampling with sterile swabs (photo by G. Doni)
This analysis makes it possible to identify all coloniser species, and to provide an overall view of the biodeterioration process.
The sequencing result is a file that is analysed using bioinformatic procedures to return the taxonomic identification of biodeteriogens and the evaluation of differences/similarities among the samples.

Collection of microorganisms using sterile swabs or use of fragments
DNA extraction and amplification
Sequencing of amplicons
Bioinformatic analyzes of FASTA files (sequencing products)
Taxonomic identification of microbes
Collecting samples of the micro-organisms present on the document is performed using simple contact with sterile swabs.
Sampling with sterile swabs (photo by G. Doni)
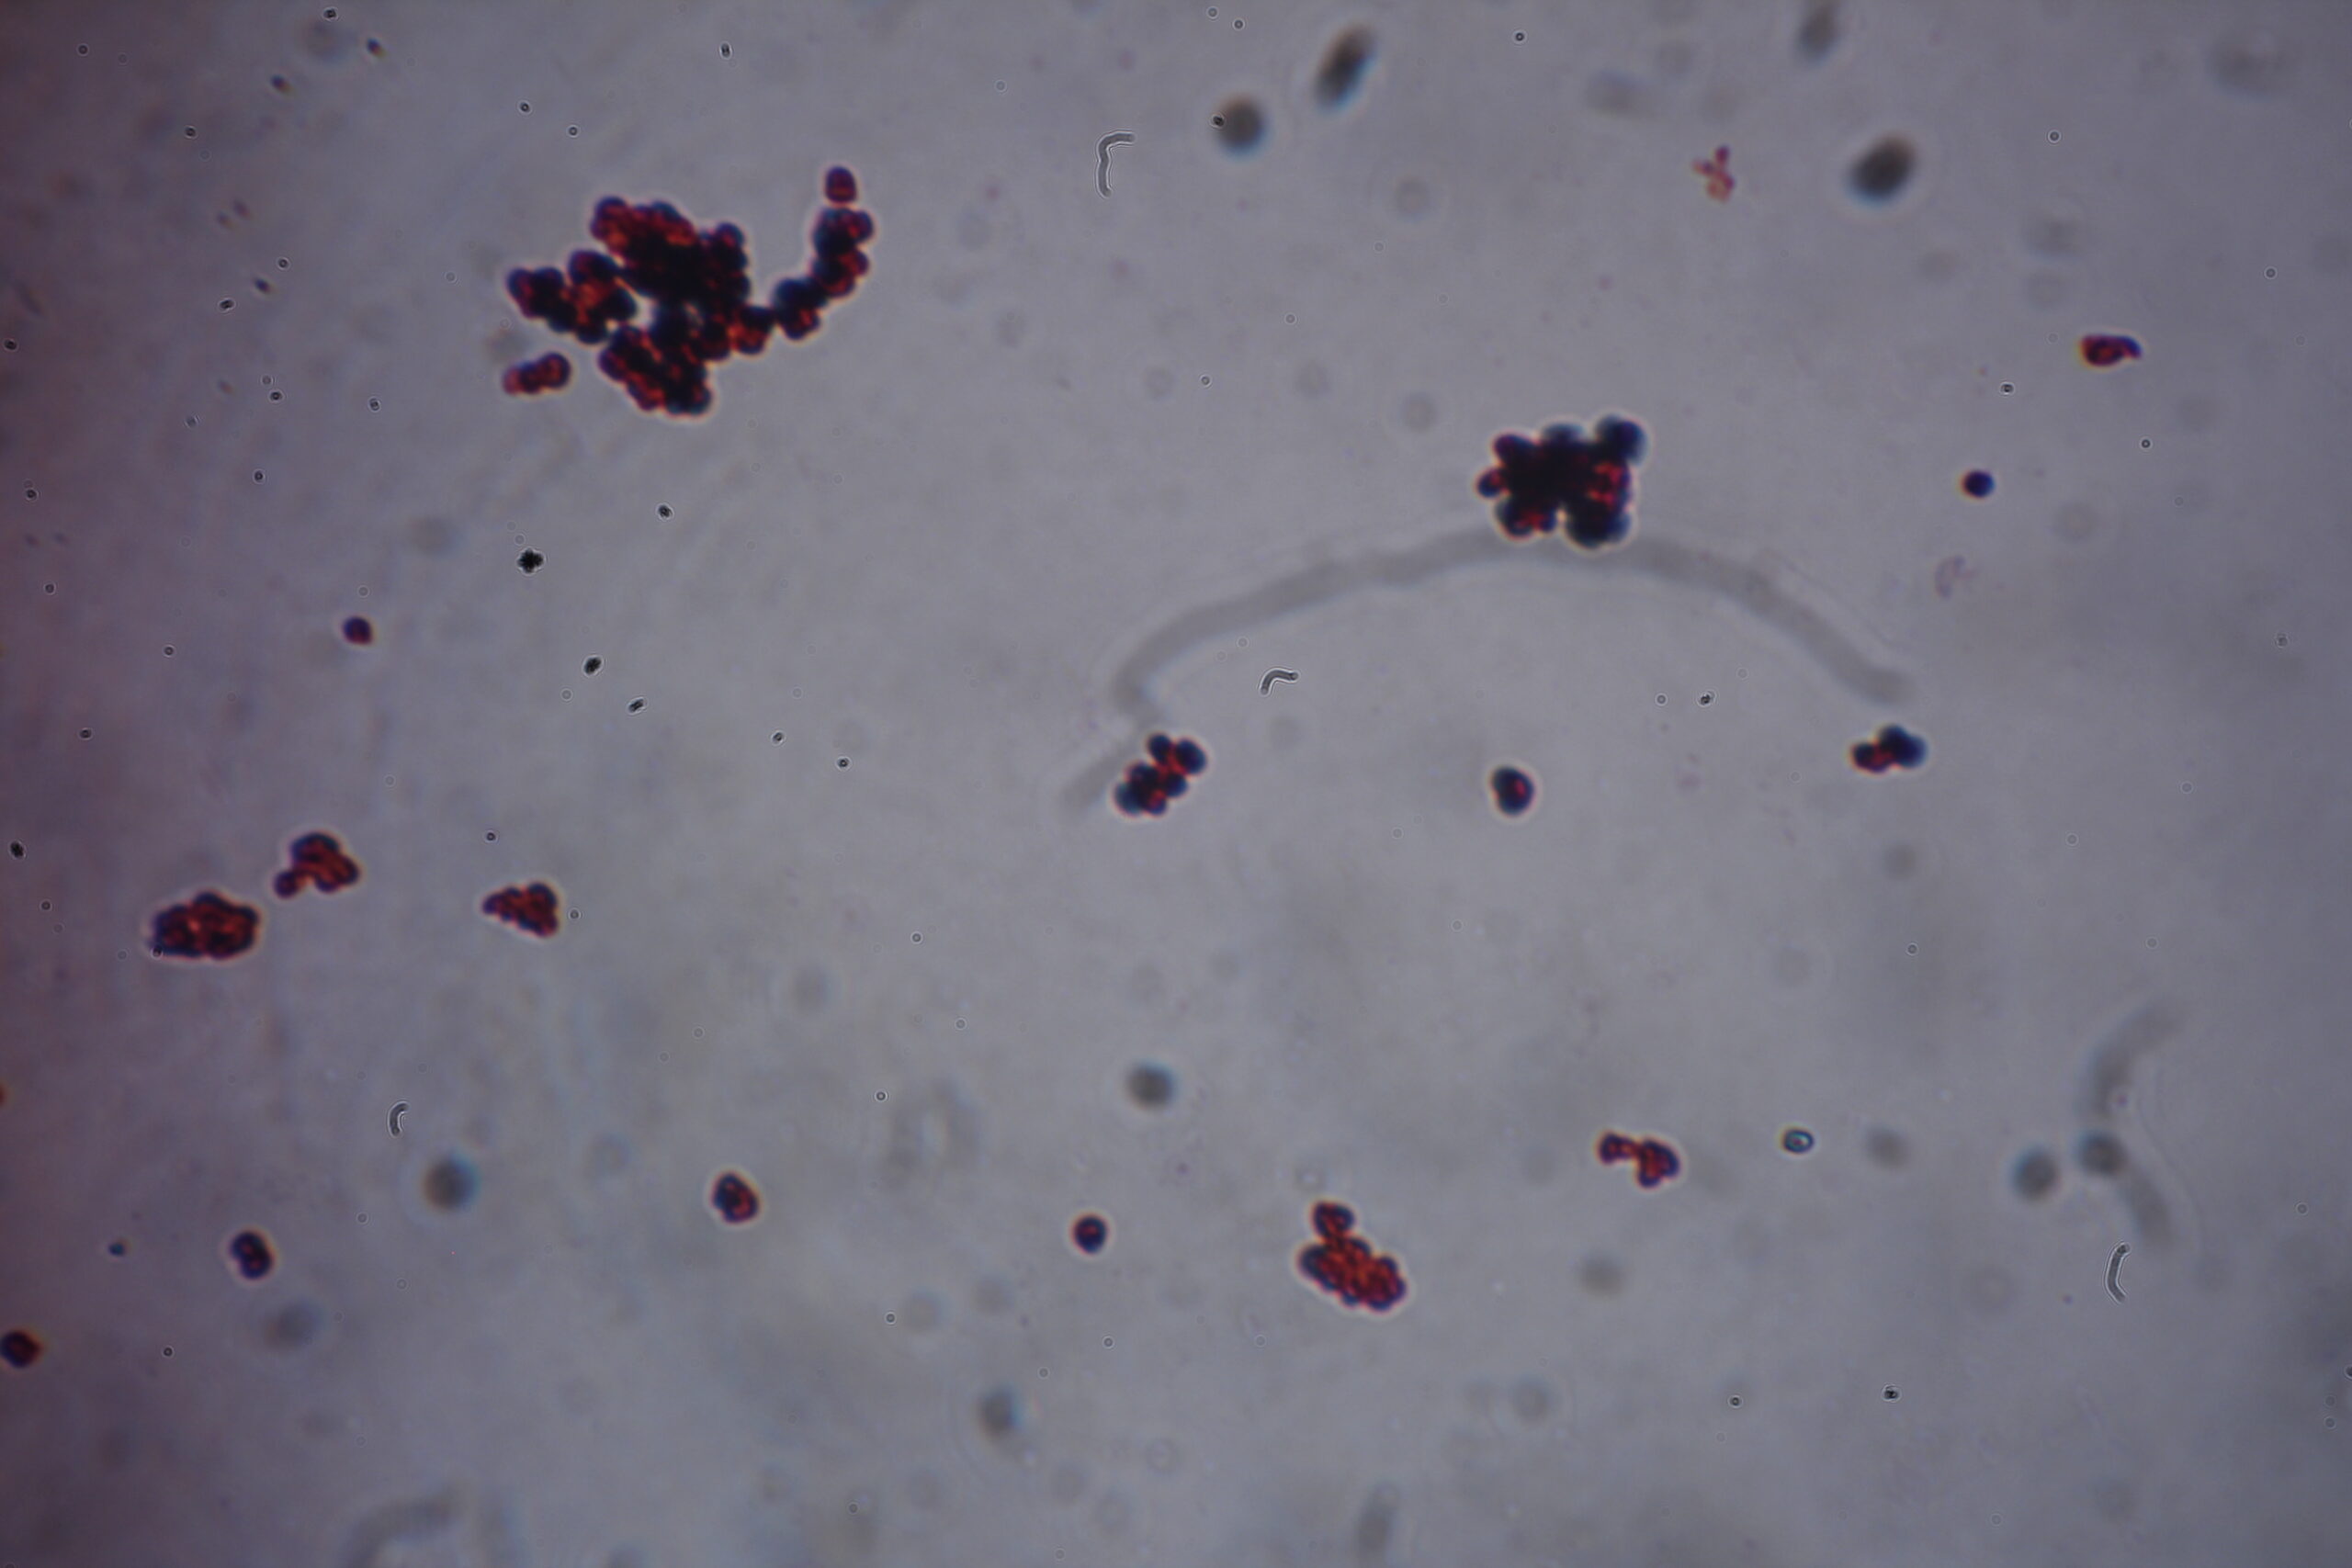
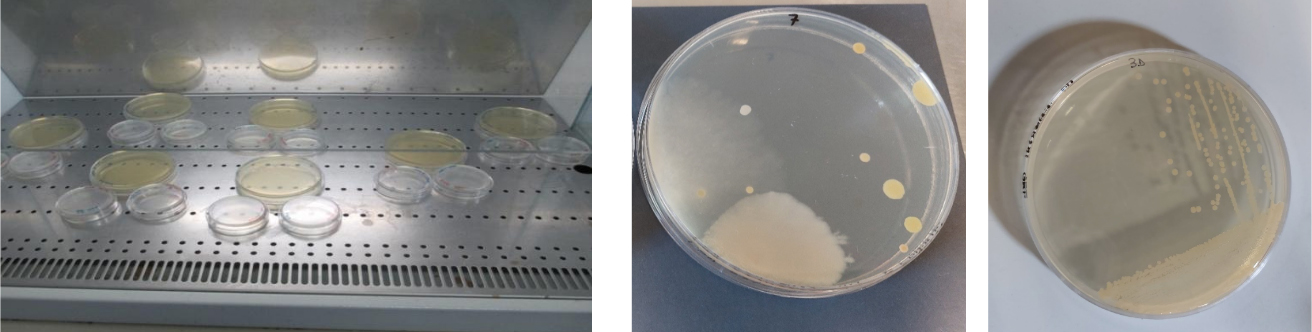
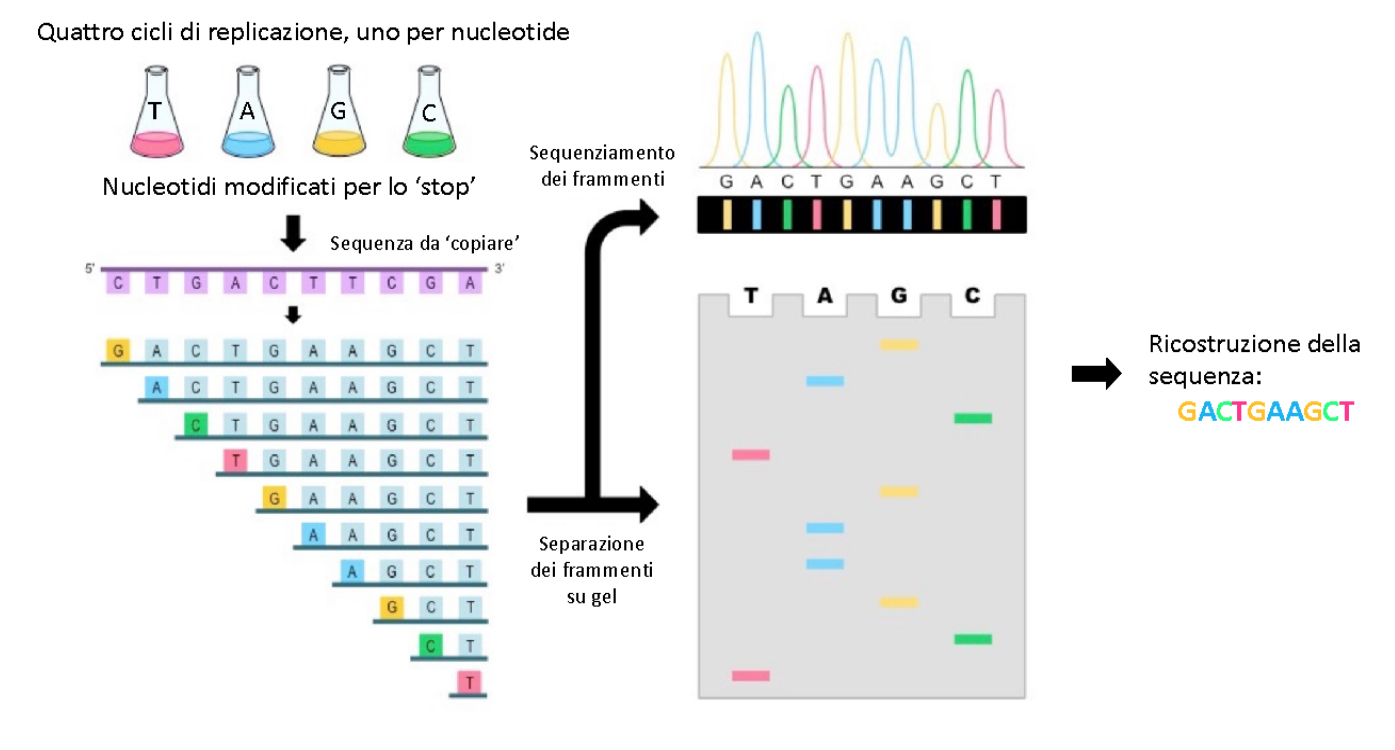
Samples collected can be used to grow and then isolate live microorganisms on appropriate culture media. Sanger sequencing, which is a technique that allows the nucleotide sequences of DNA extracted from cultures of isolated microorganisms to be determined, is used to taxonomically identify the microorganisms grown. Since the sequencing of specific microbe genome segments is characteristic for each strain, sequencing of these genome fragments allows the culture to be taxonomically identified.
The Sanger sequencing method starts by separating the DNA to be sequenced into two strands. The strand to be sequenced is copied using a mixture of normal nucleotides and chemically modified nucleotides, which cause the copying process to be interrupted each time they are incorporated into the growing strand, to define the positions where each base is located.
The process is performed separately for each of the four nitrogenous bases in the nucleotides. The outcome, i.e., the original DNA sequence, is obtained by reconstructing the positions of each base like a jigsaw puzzle.

Collection of microorganisms through contact with sterile swabs
Isolation of live microorganisms with classical microbiology culture methods
DNA extraction and amplification
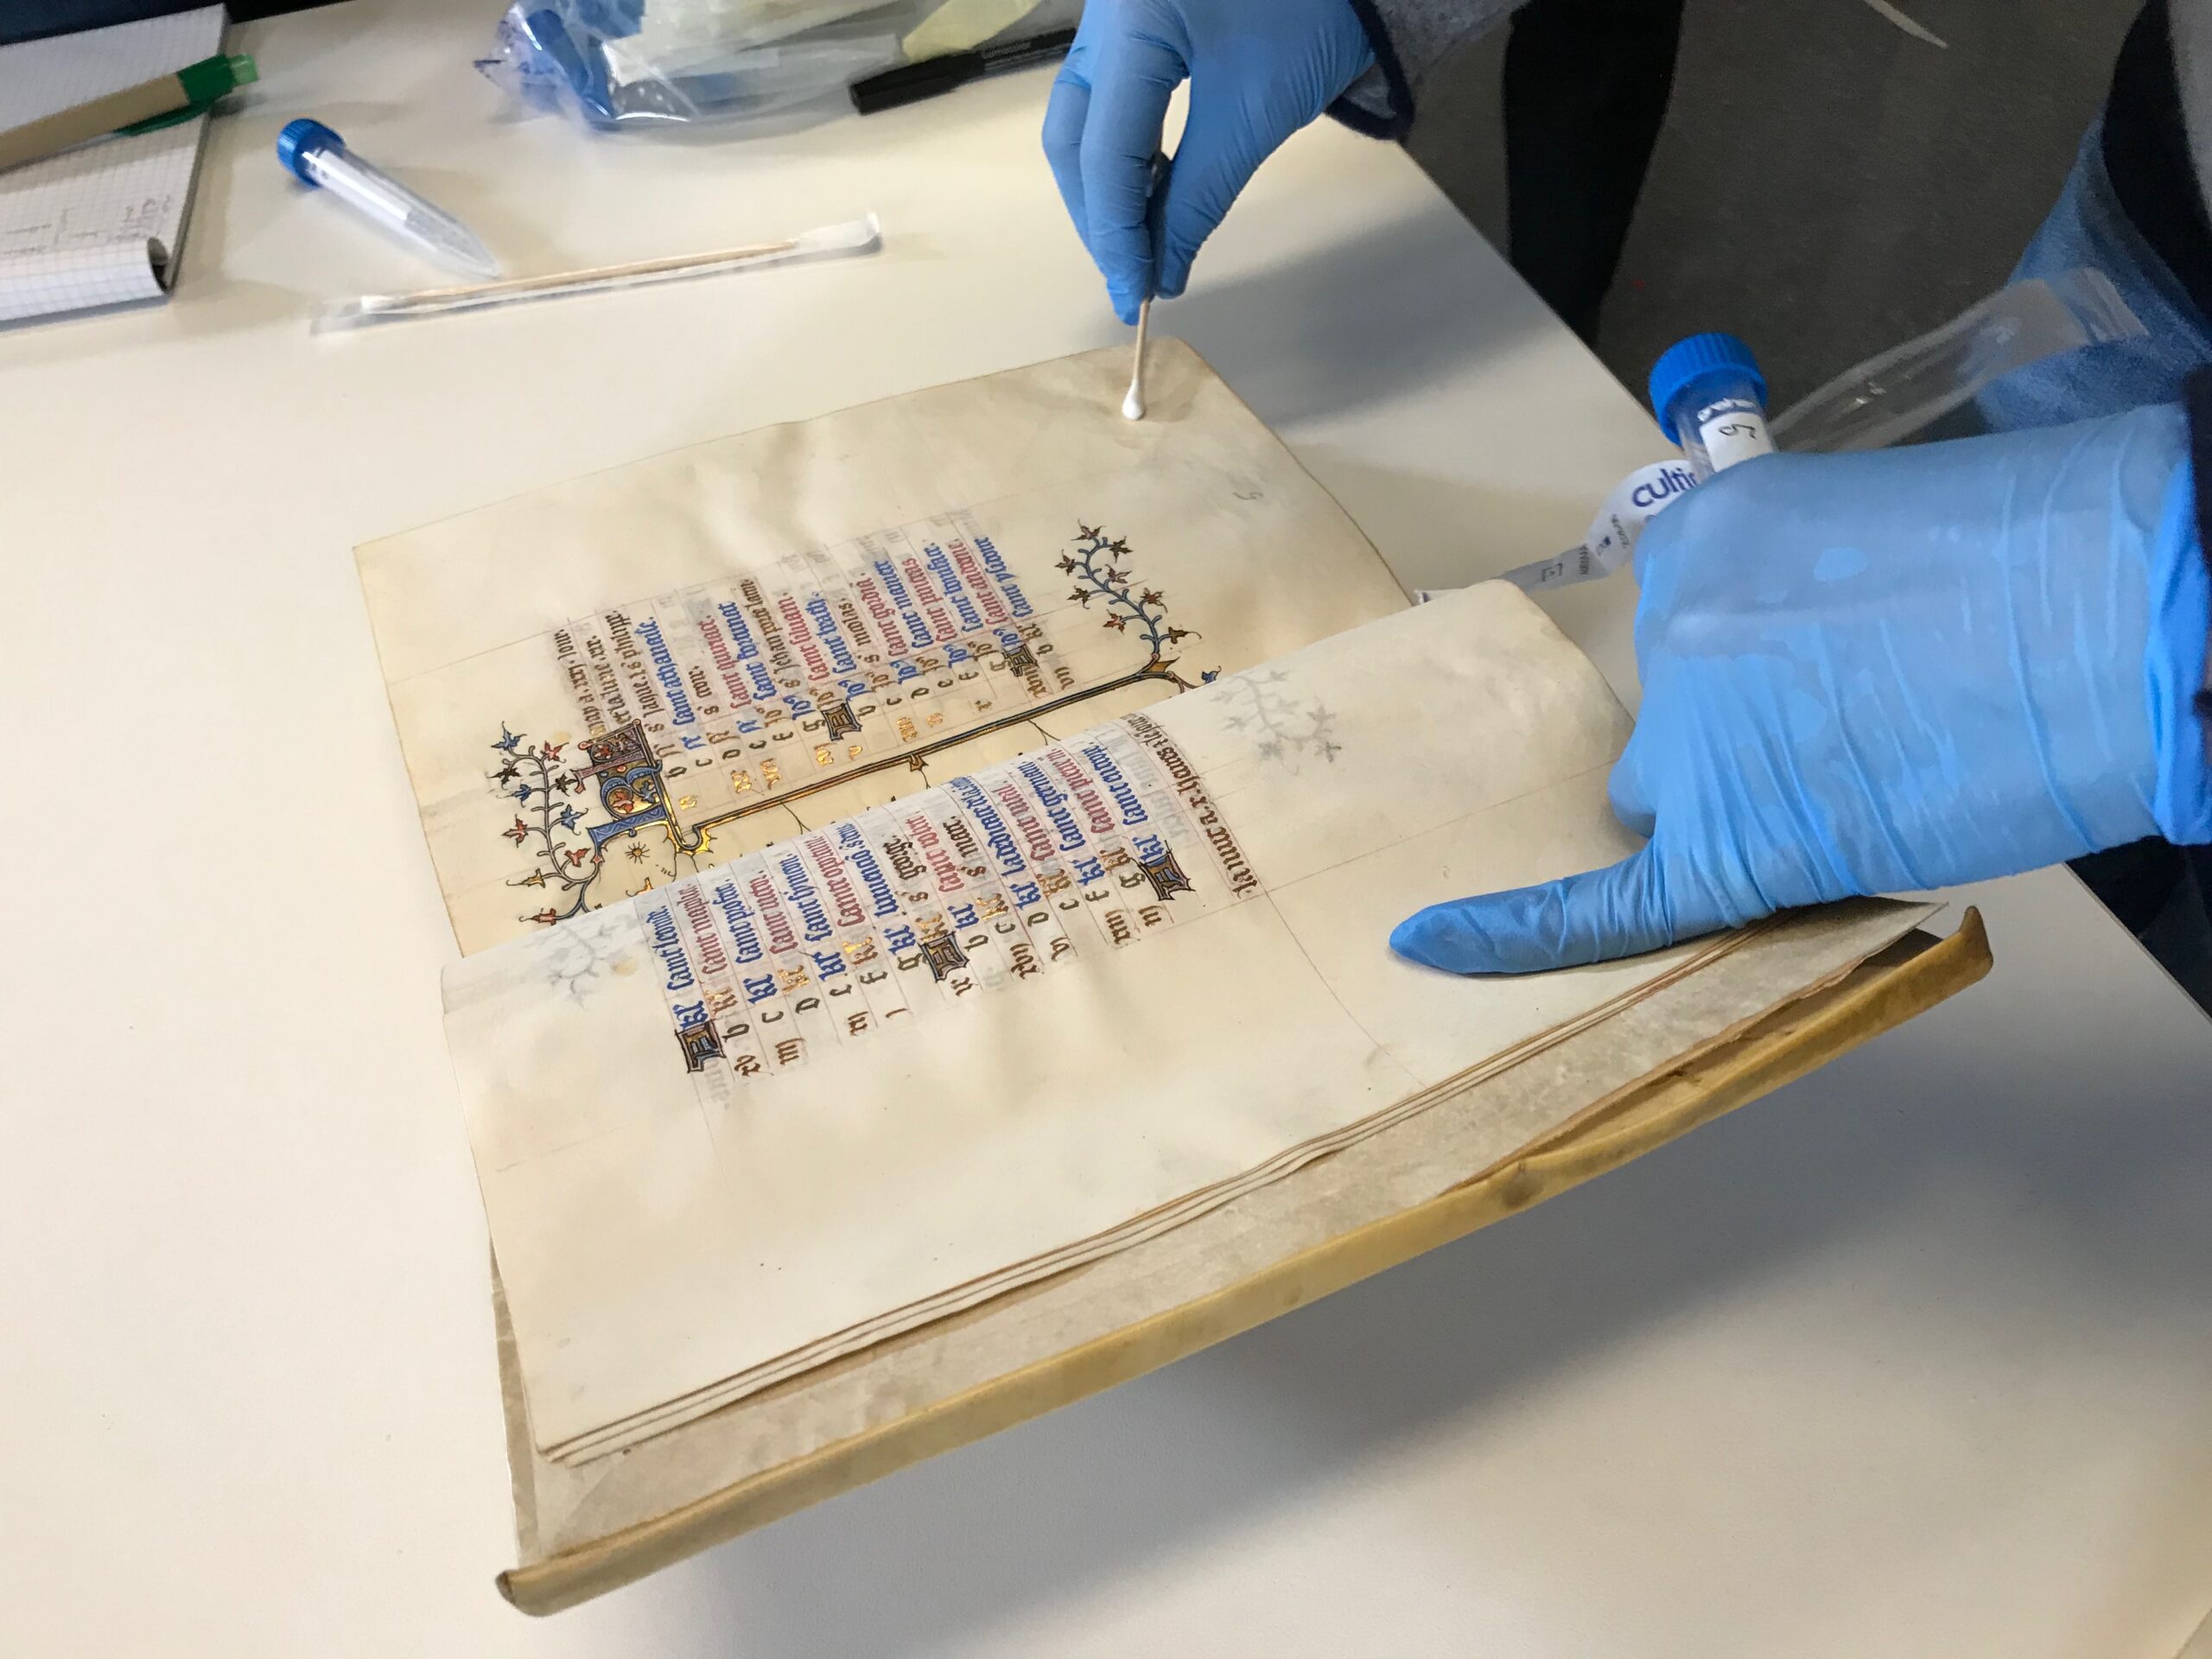
The sampling grid is arranged on the pages of the work for the identification of points of interest.
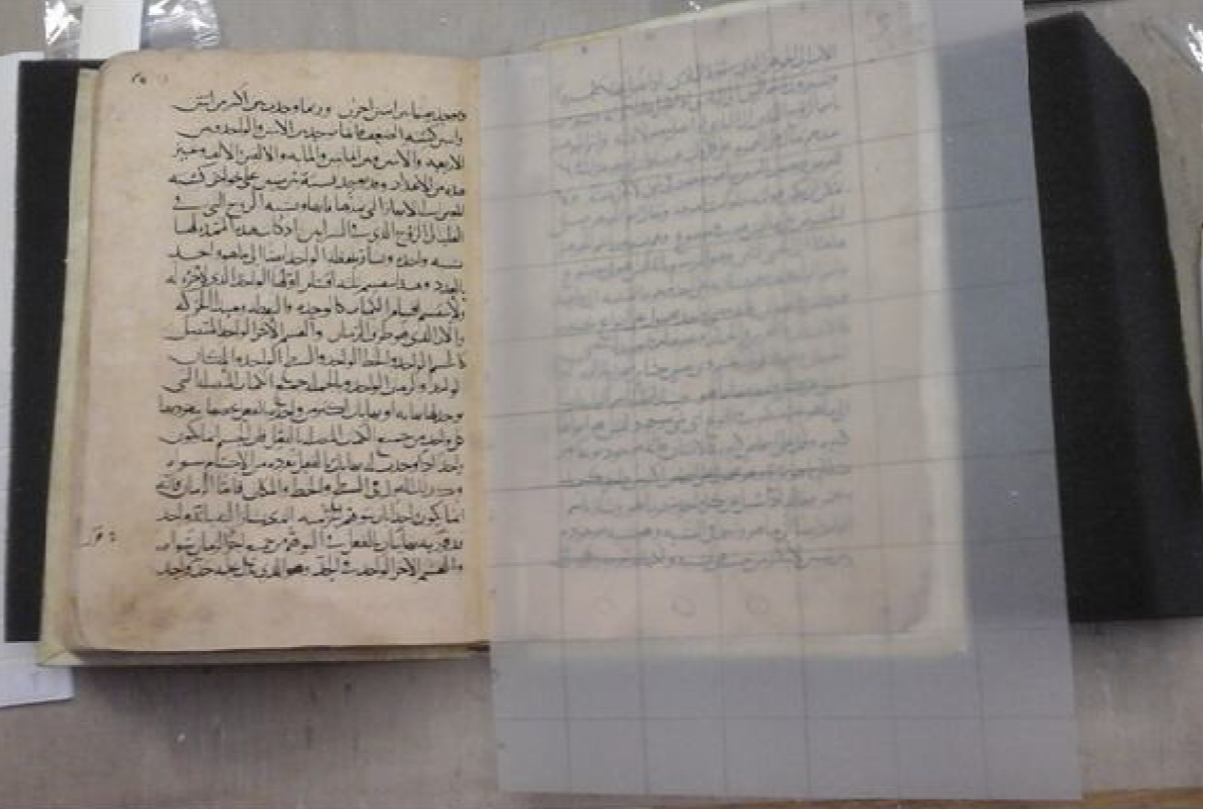
Positioning of the sampling “grid” on the pages of the paper work and identification of points of interest
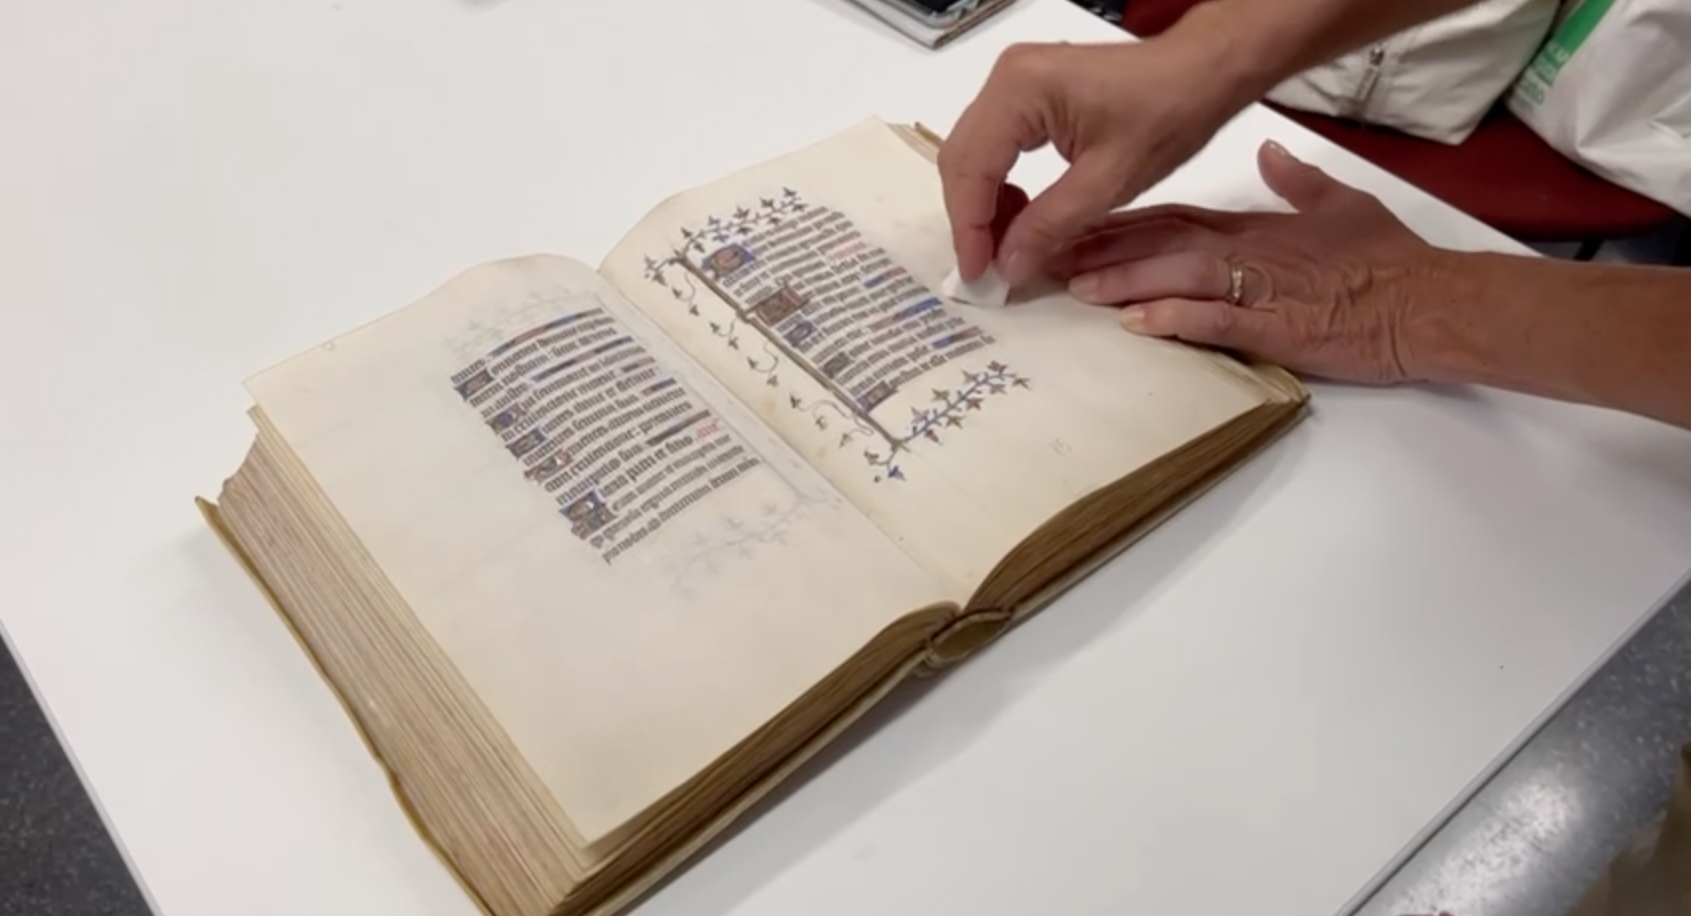
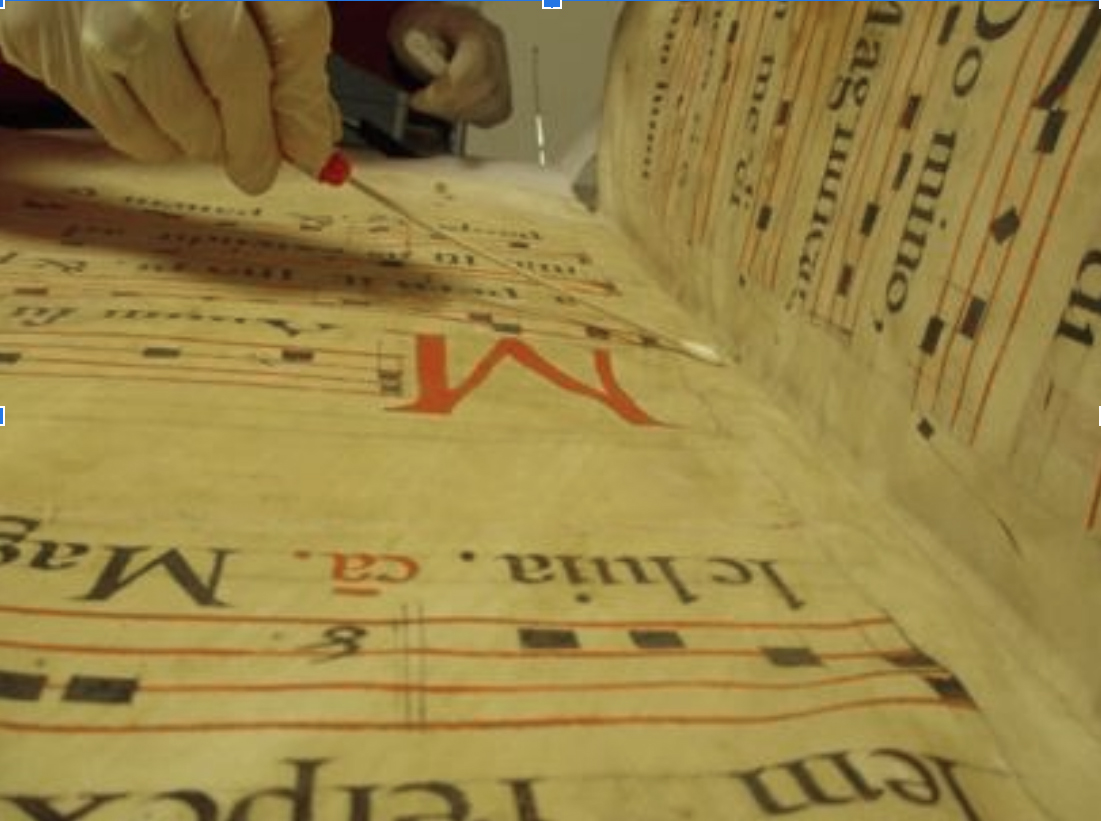
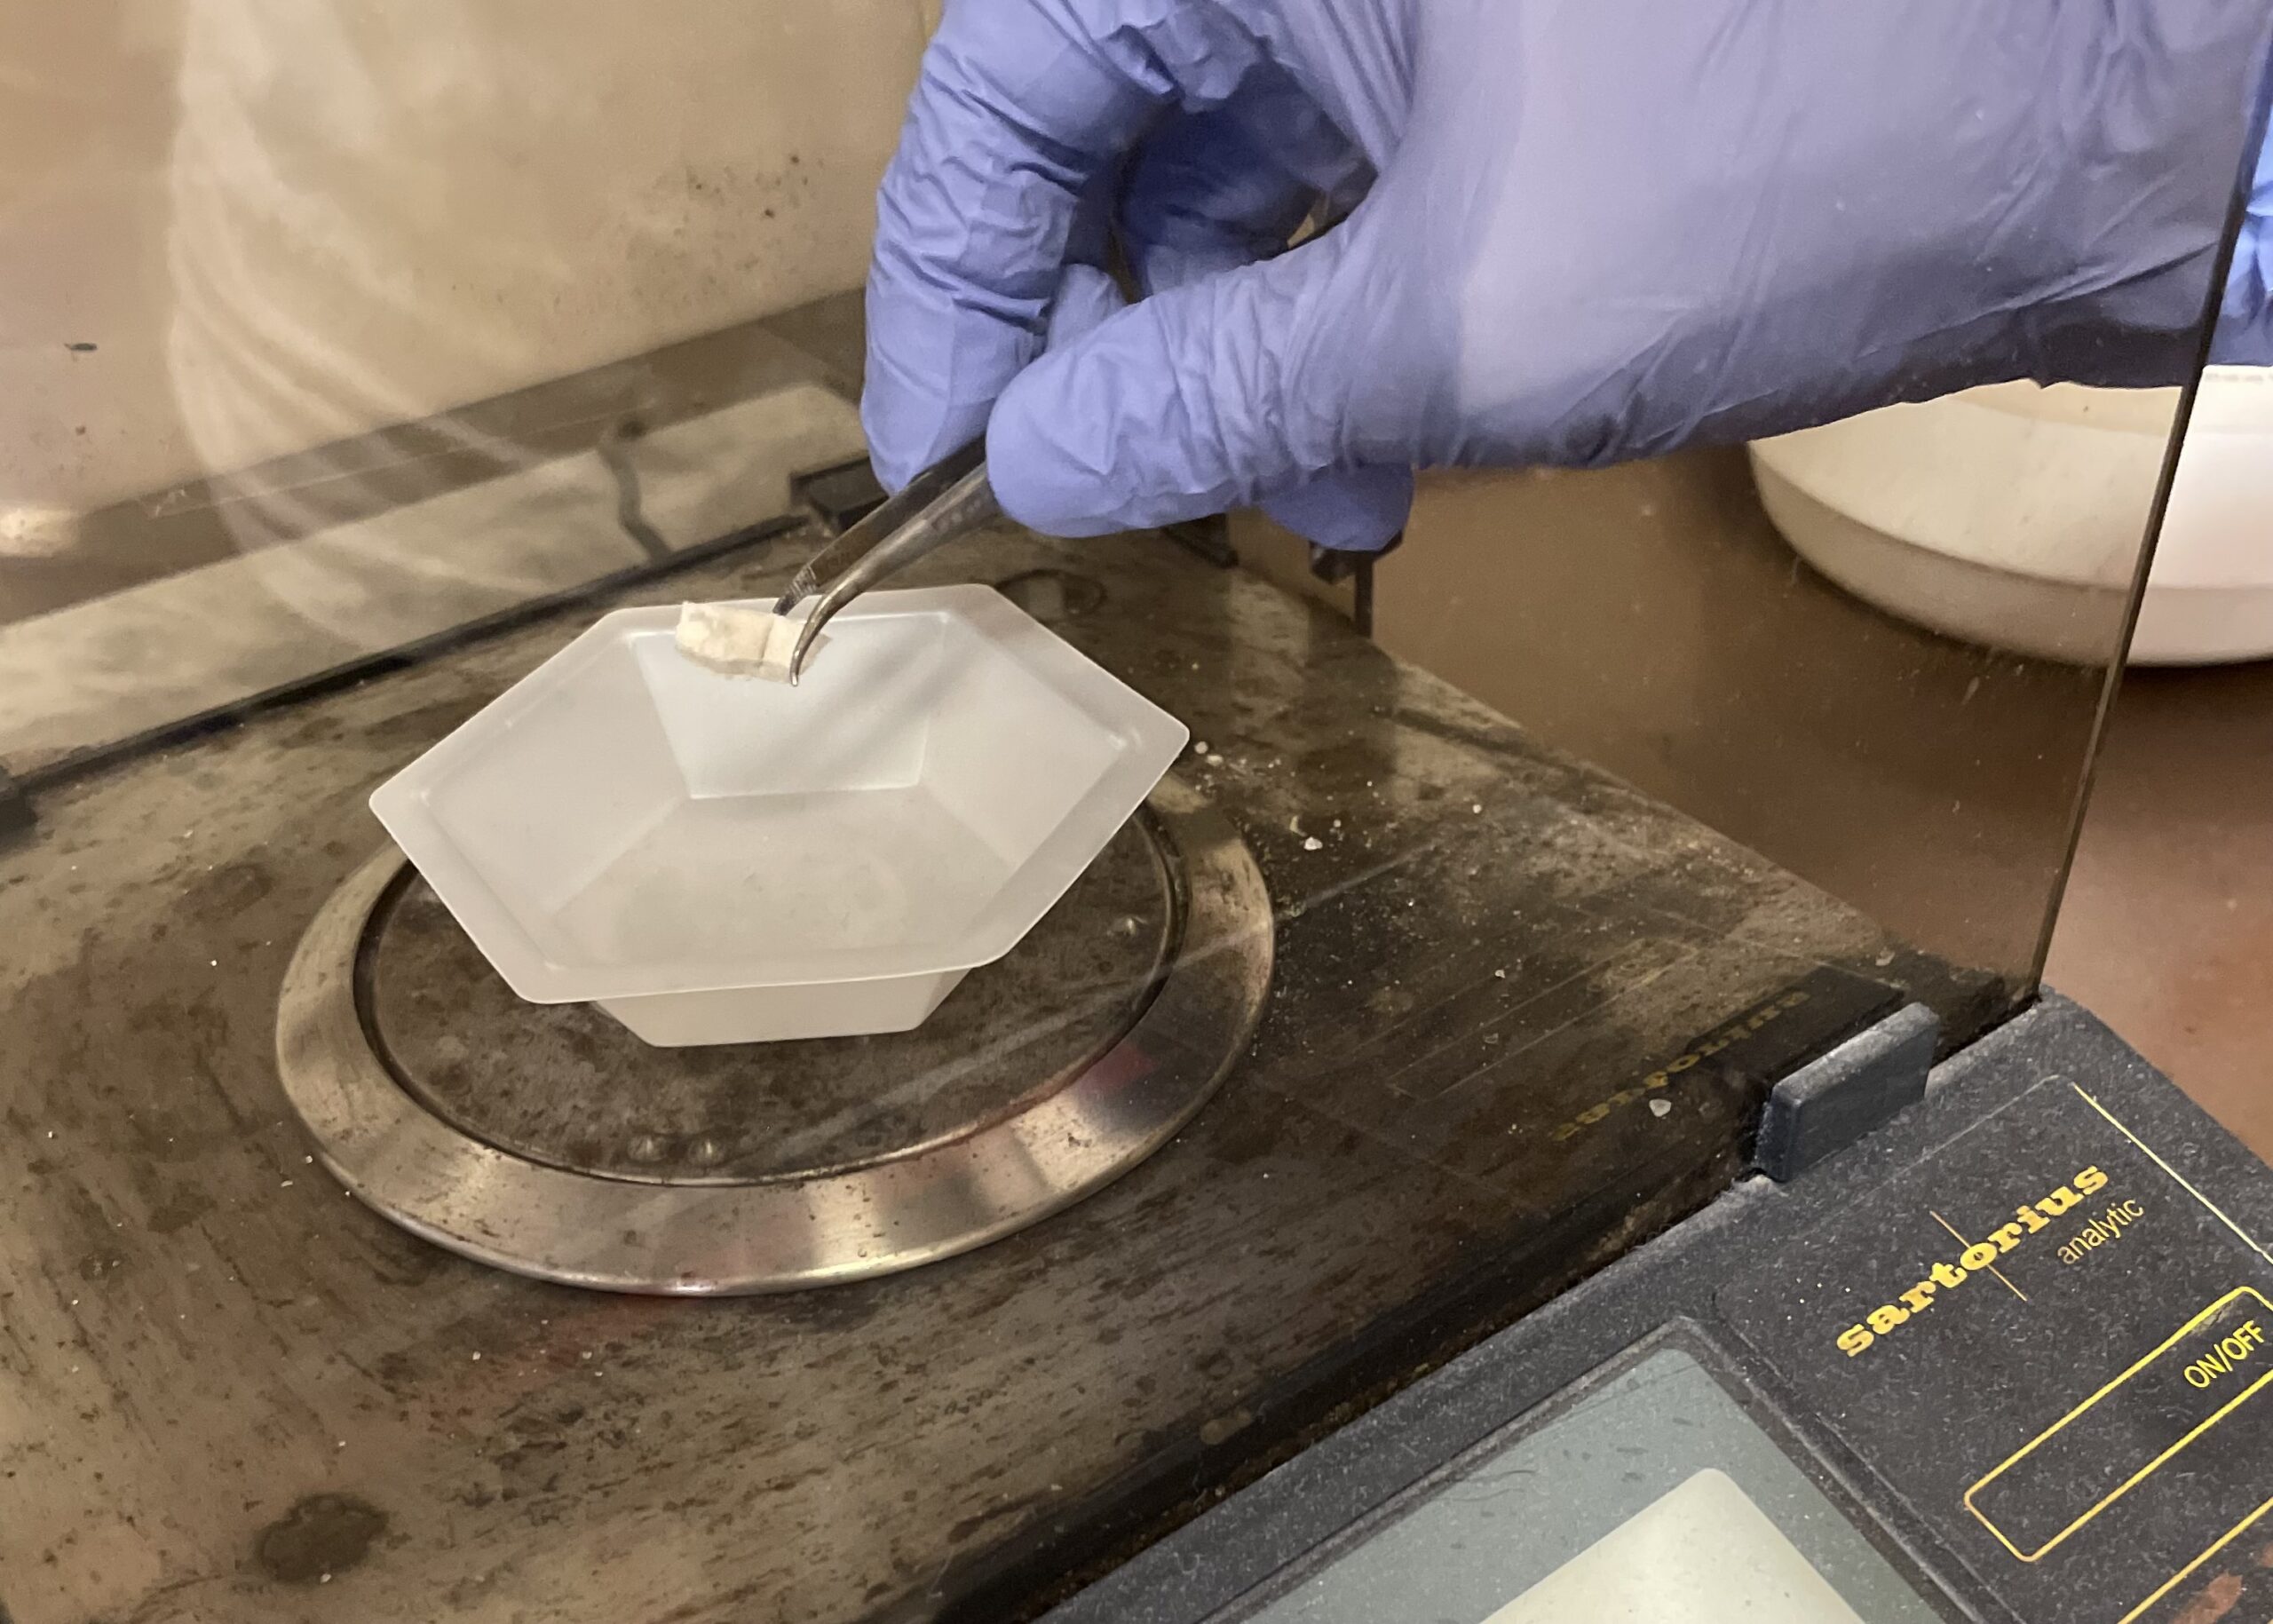
The sampling procedure is based on “rubbing” the paper work with latex sponges (fig. 1b) at the points of interest.

Sampling with a latex sponge
The area of the sponge that came into contact with the paper sample is cut out, weighed and placed for extraction in a solvent akin to the compound to be analysed (water or alcohol).
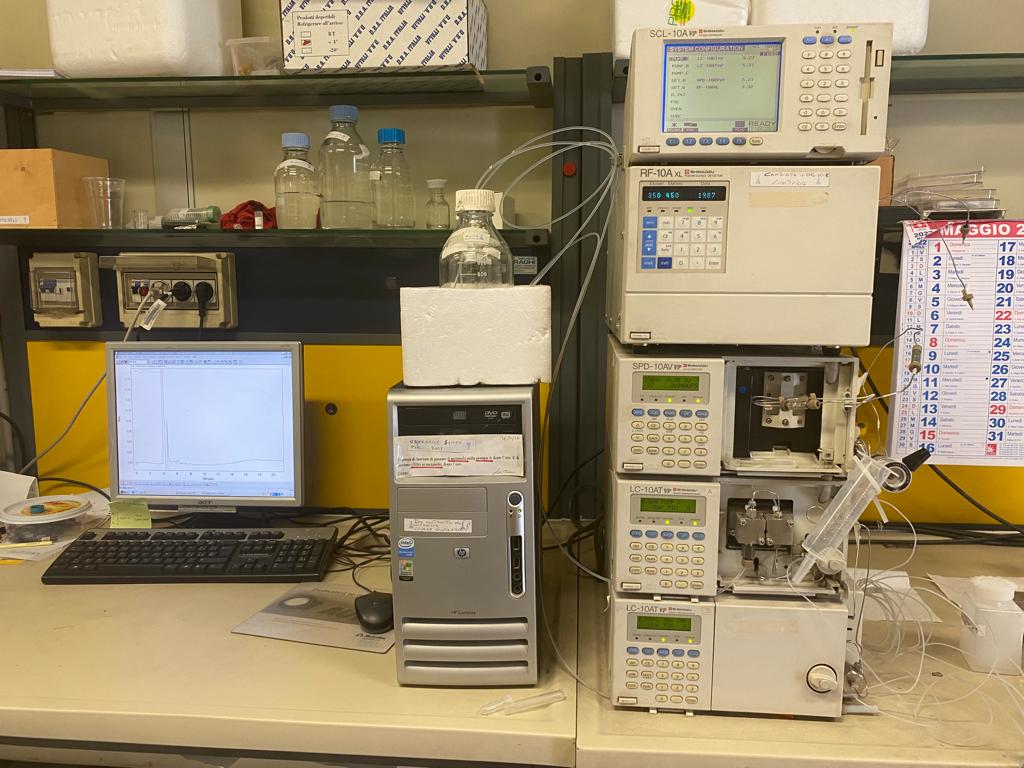
Solvent extraction is undertaken overnight, while stirring. The resulting solution is filtered and analysed.
A characteristic chromatographic profile (or chromatogram, fig. 3) is obtained. Each peak and its corresponding retention time can be associated with a degradation product of the paper, a component used in its preparation or “dirt” removed.
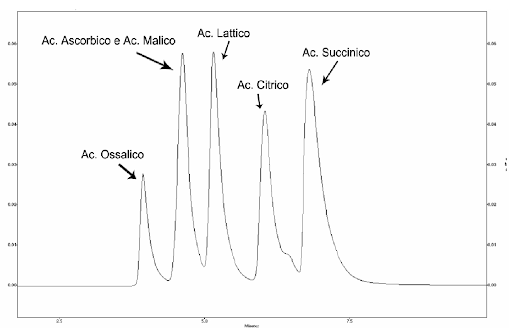
Chromatogram obtained with the standards of the paper’s acid components from pulp degradation.

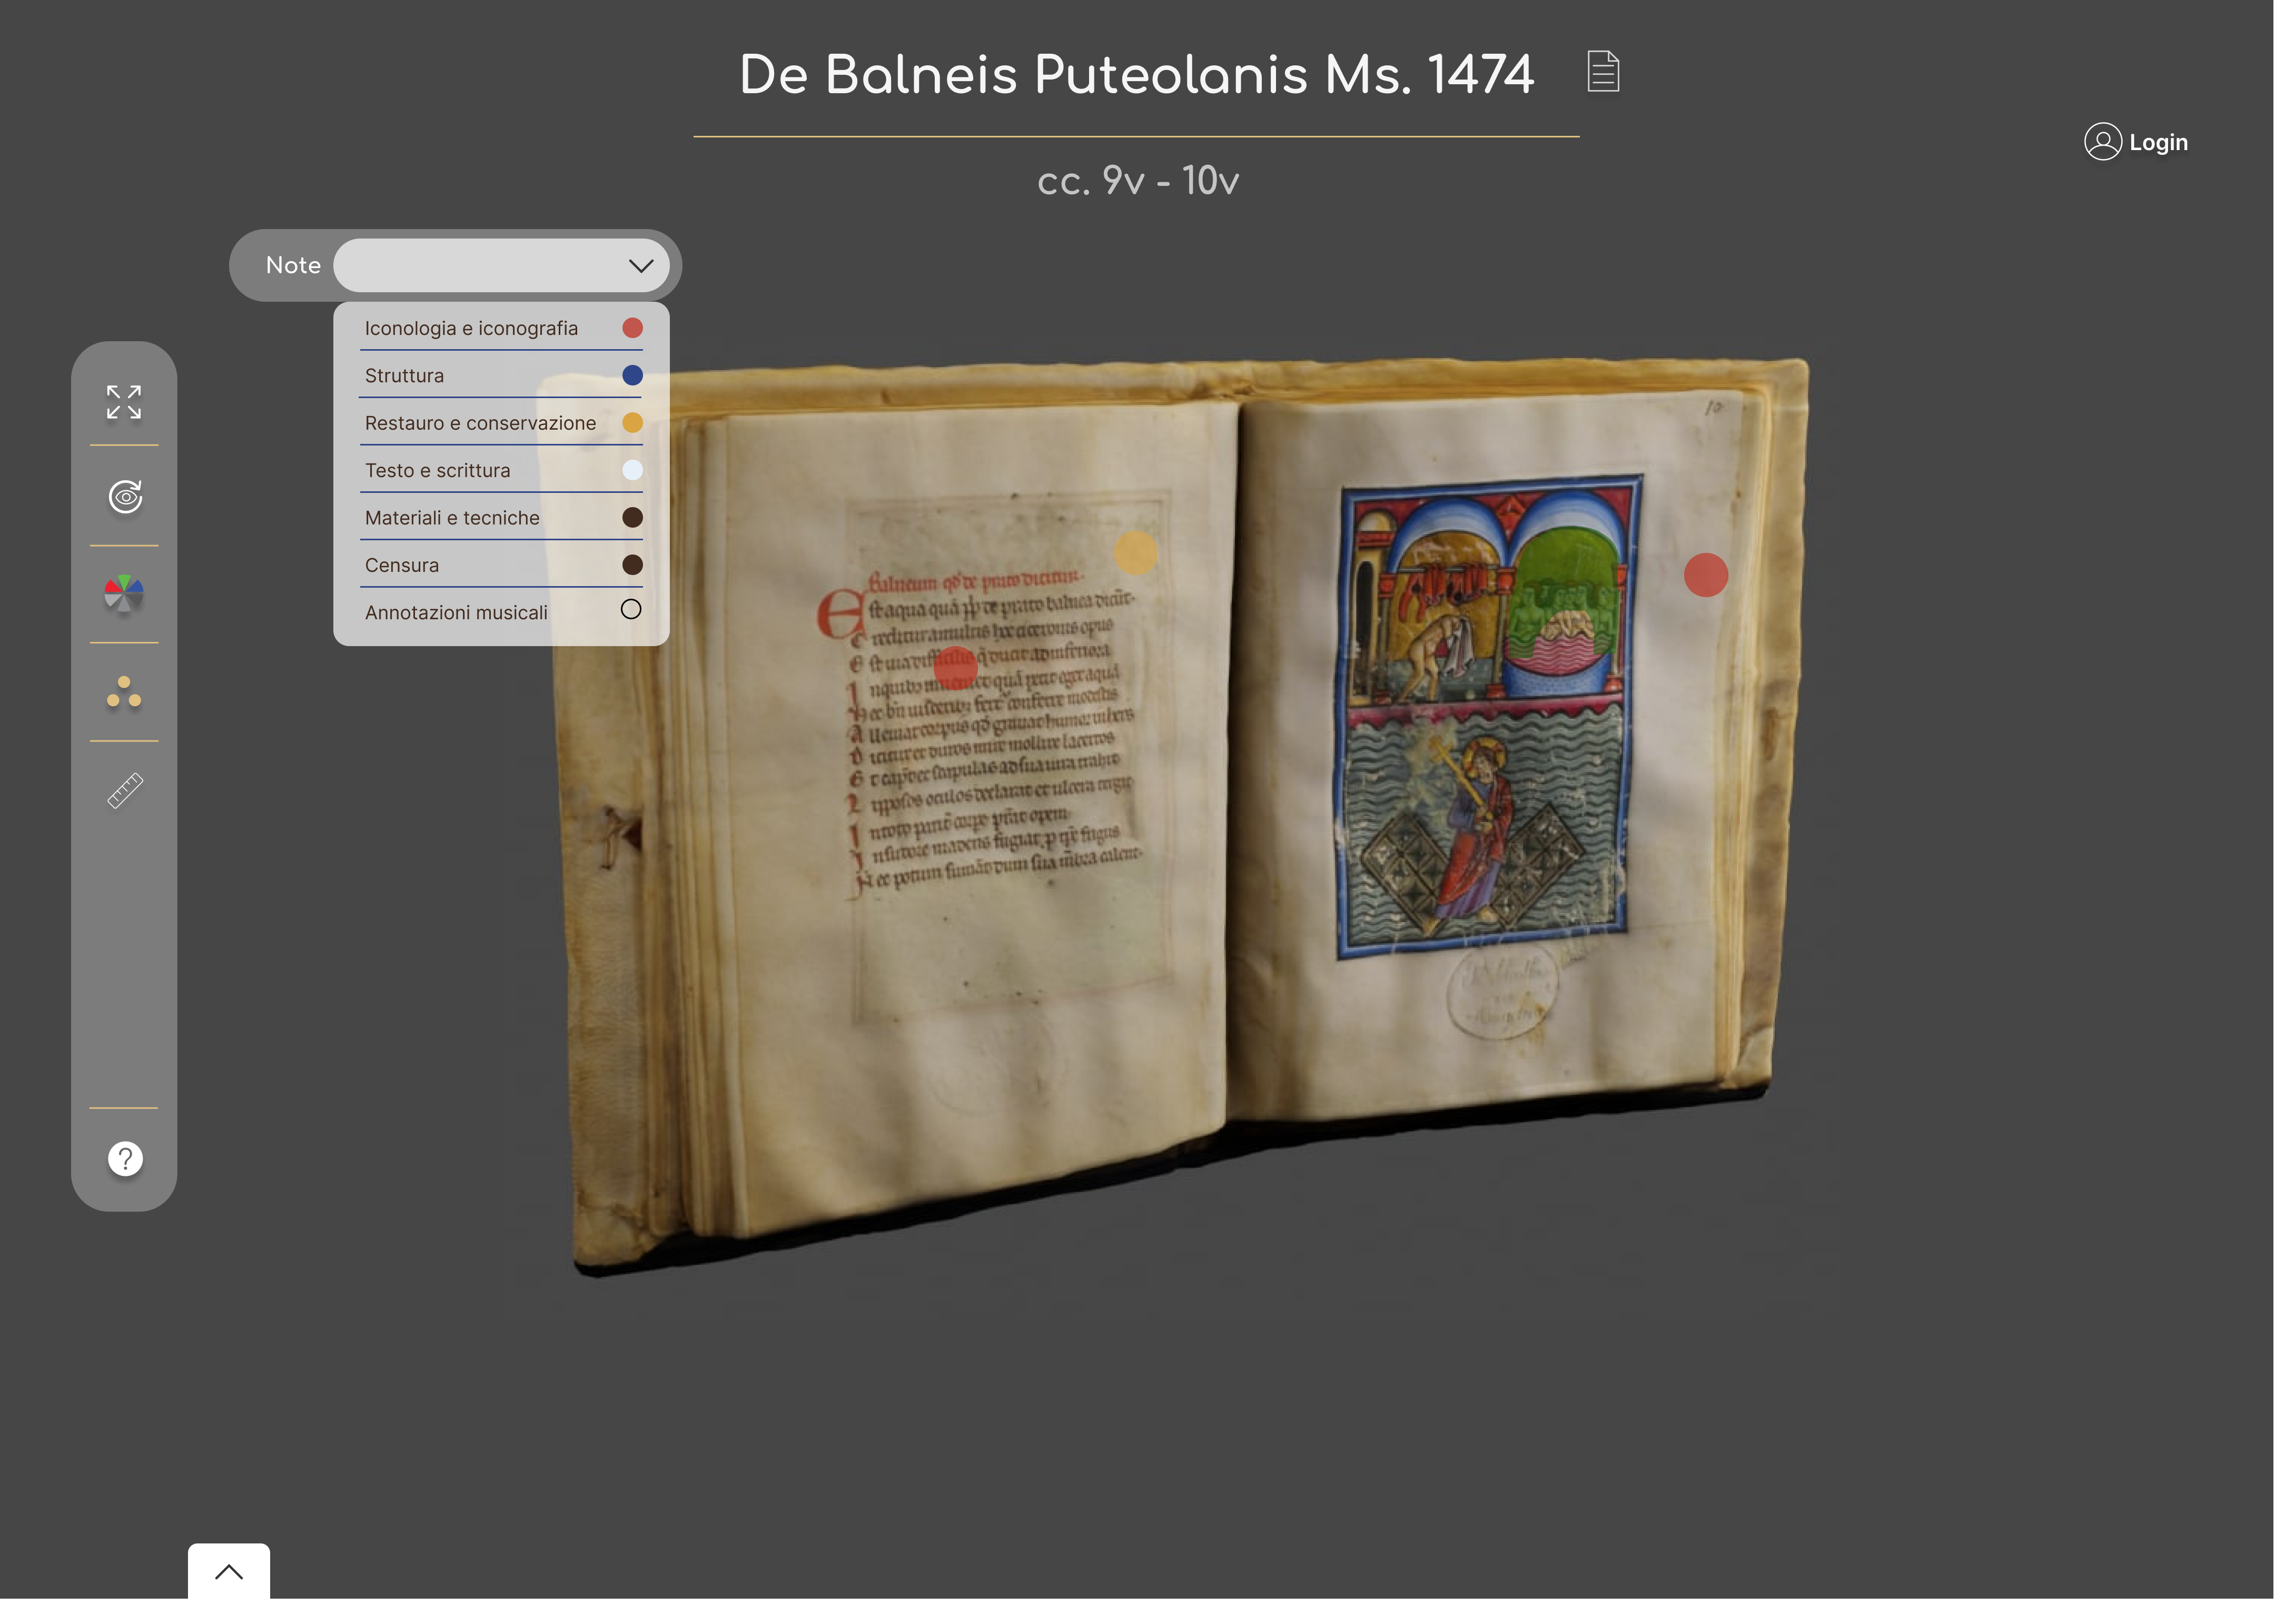
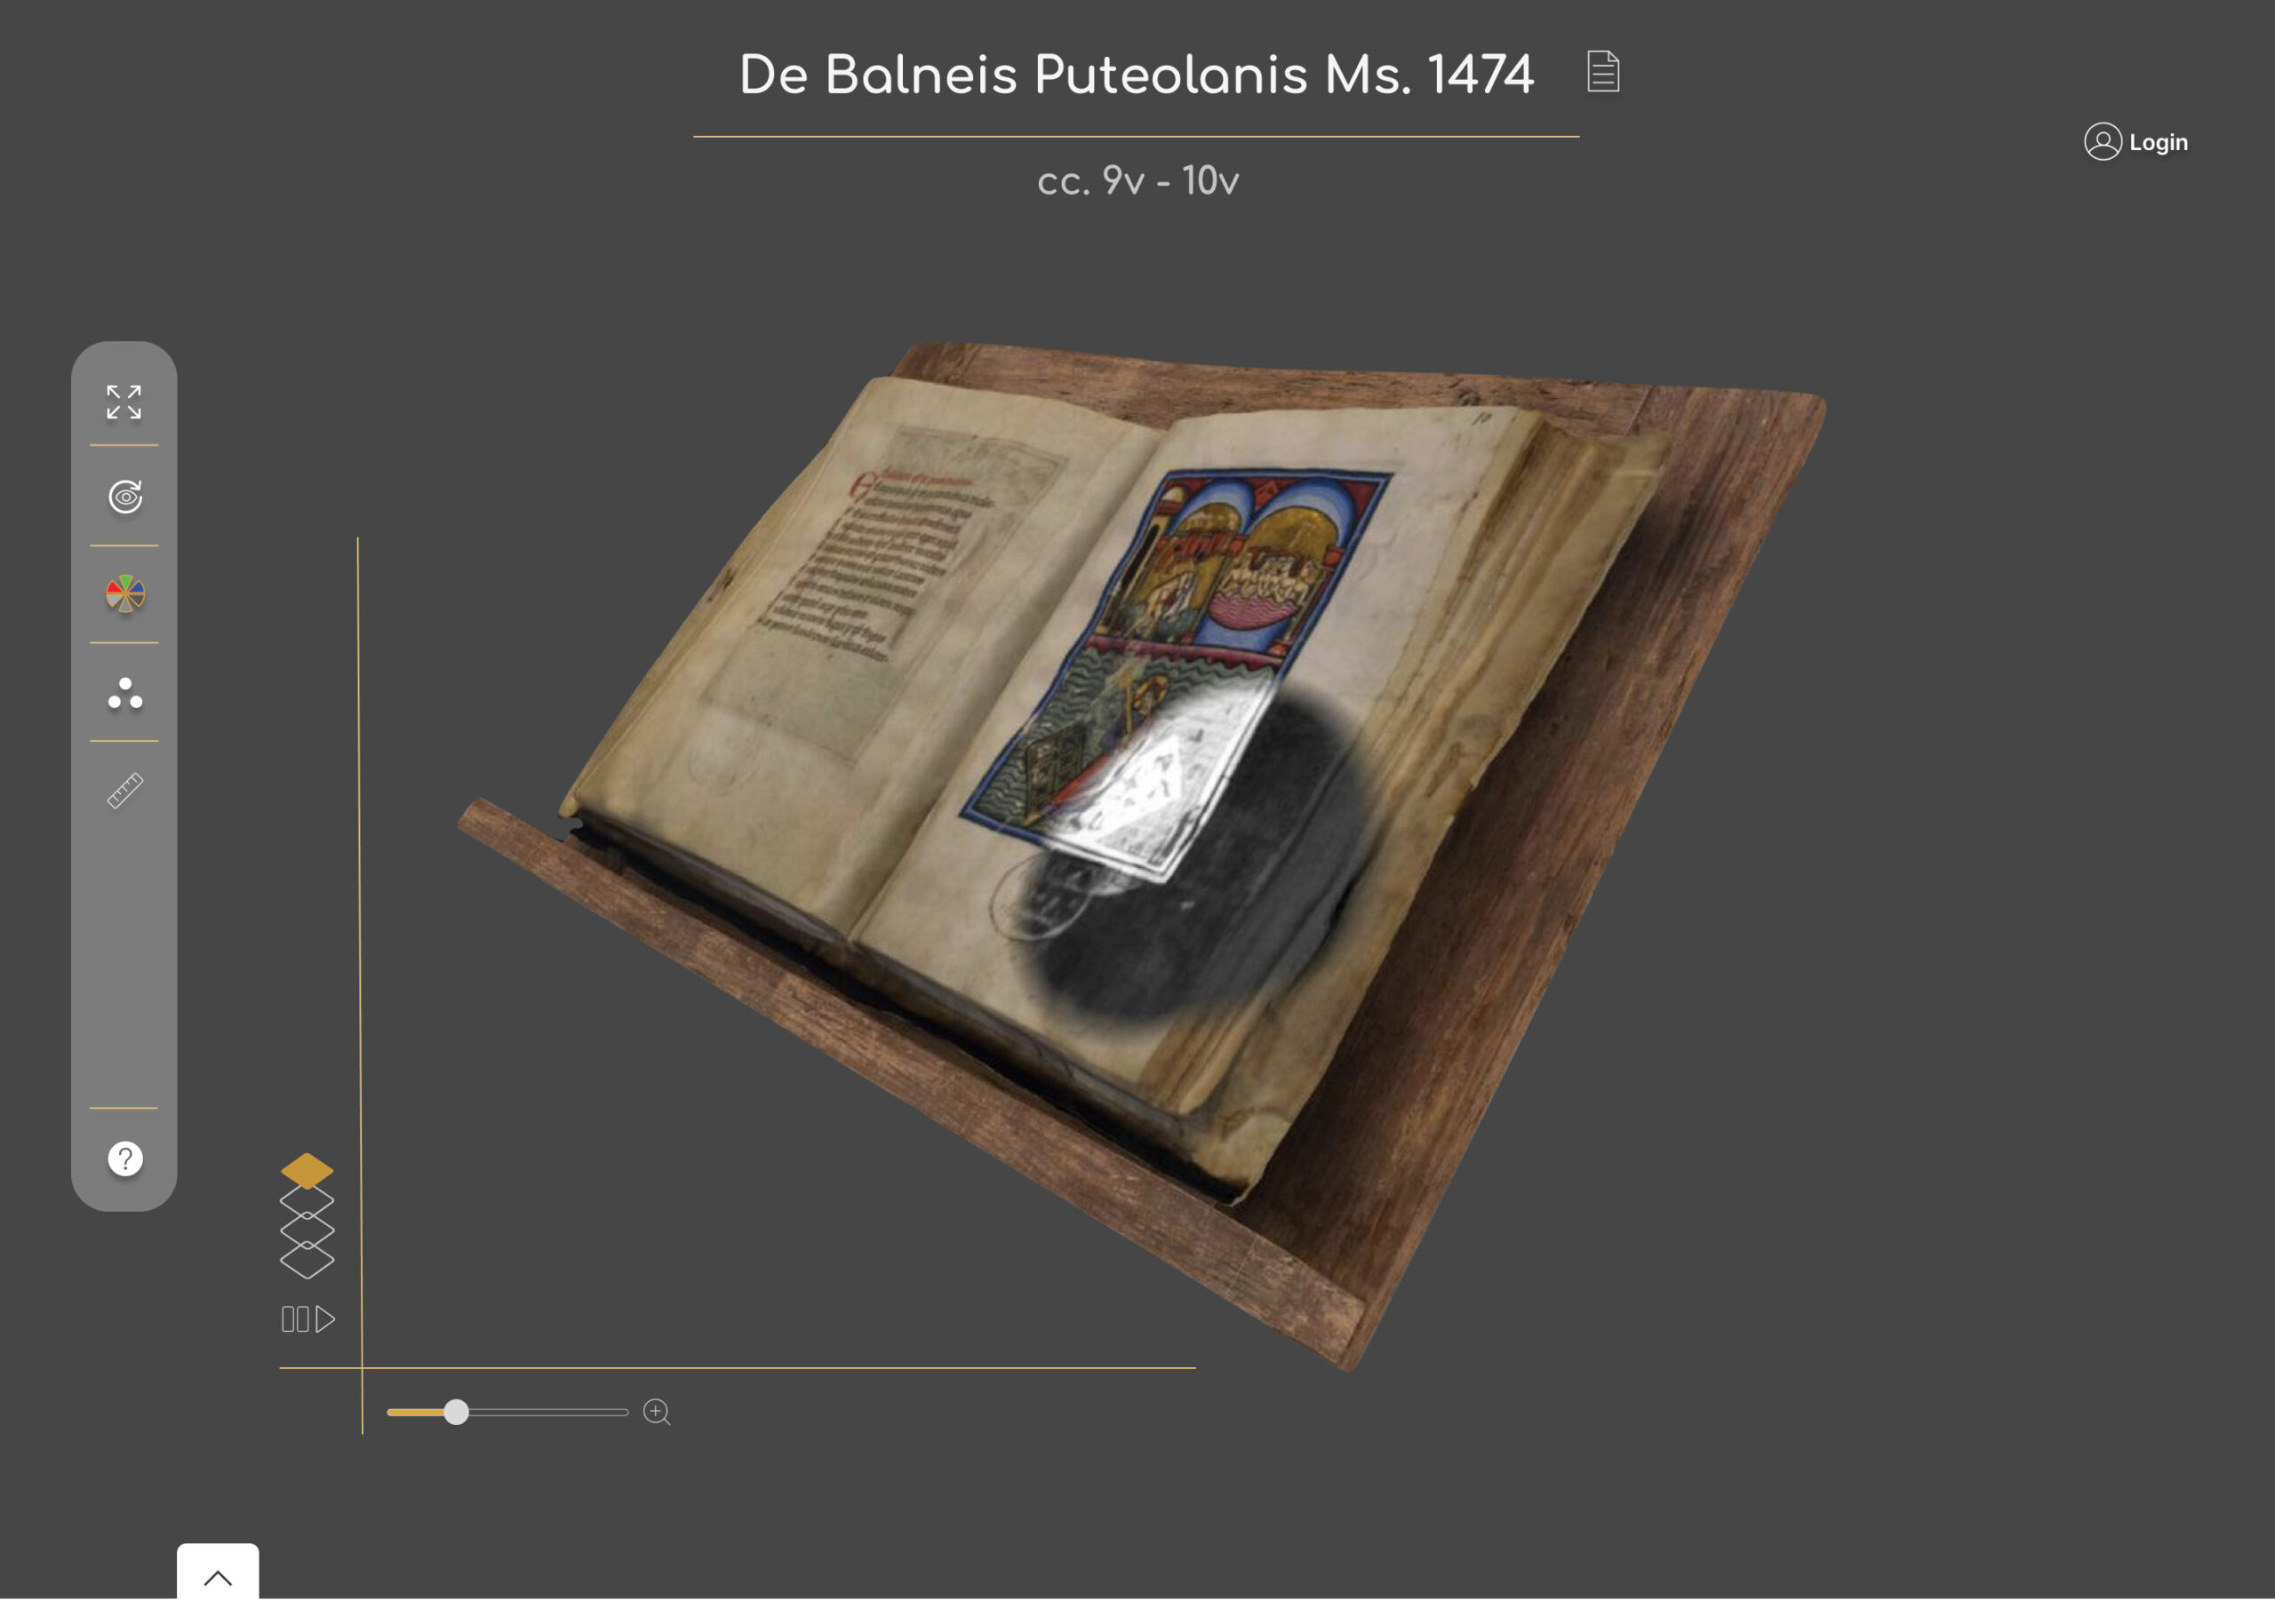
In the Codex 4D project, some pre-existing functions, useful for the creation of the interactive 4D manuscript inspection tool, were identified. Specifically: semantic annotation functions of points or portions of the object and the possibility of associating multimedia content (text, images, audio/video, etc.); advanced navigation and viewpoint management functions; authentication functions (editor profiles); customisable interface components (UI) based on profiles; analysis tools such as the measurement tool and the interactive detector lens.
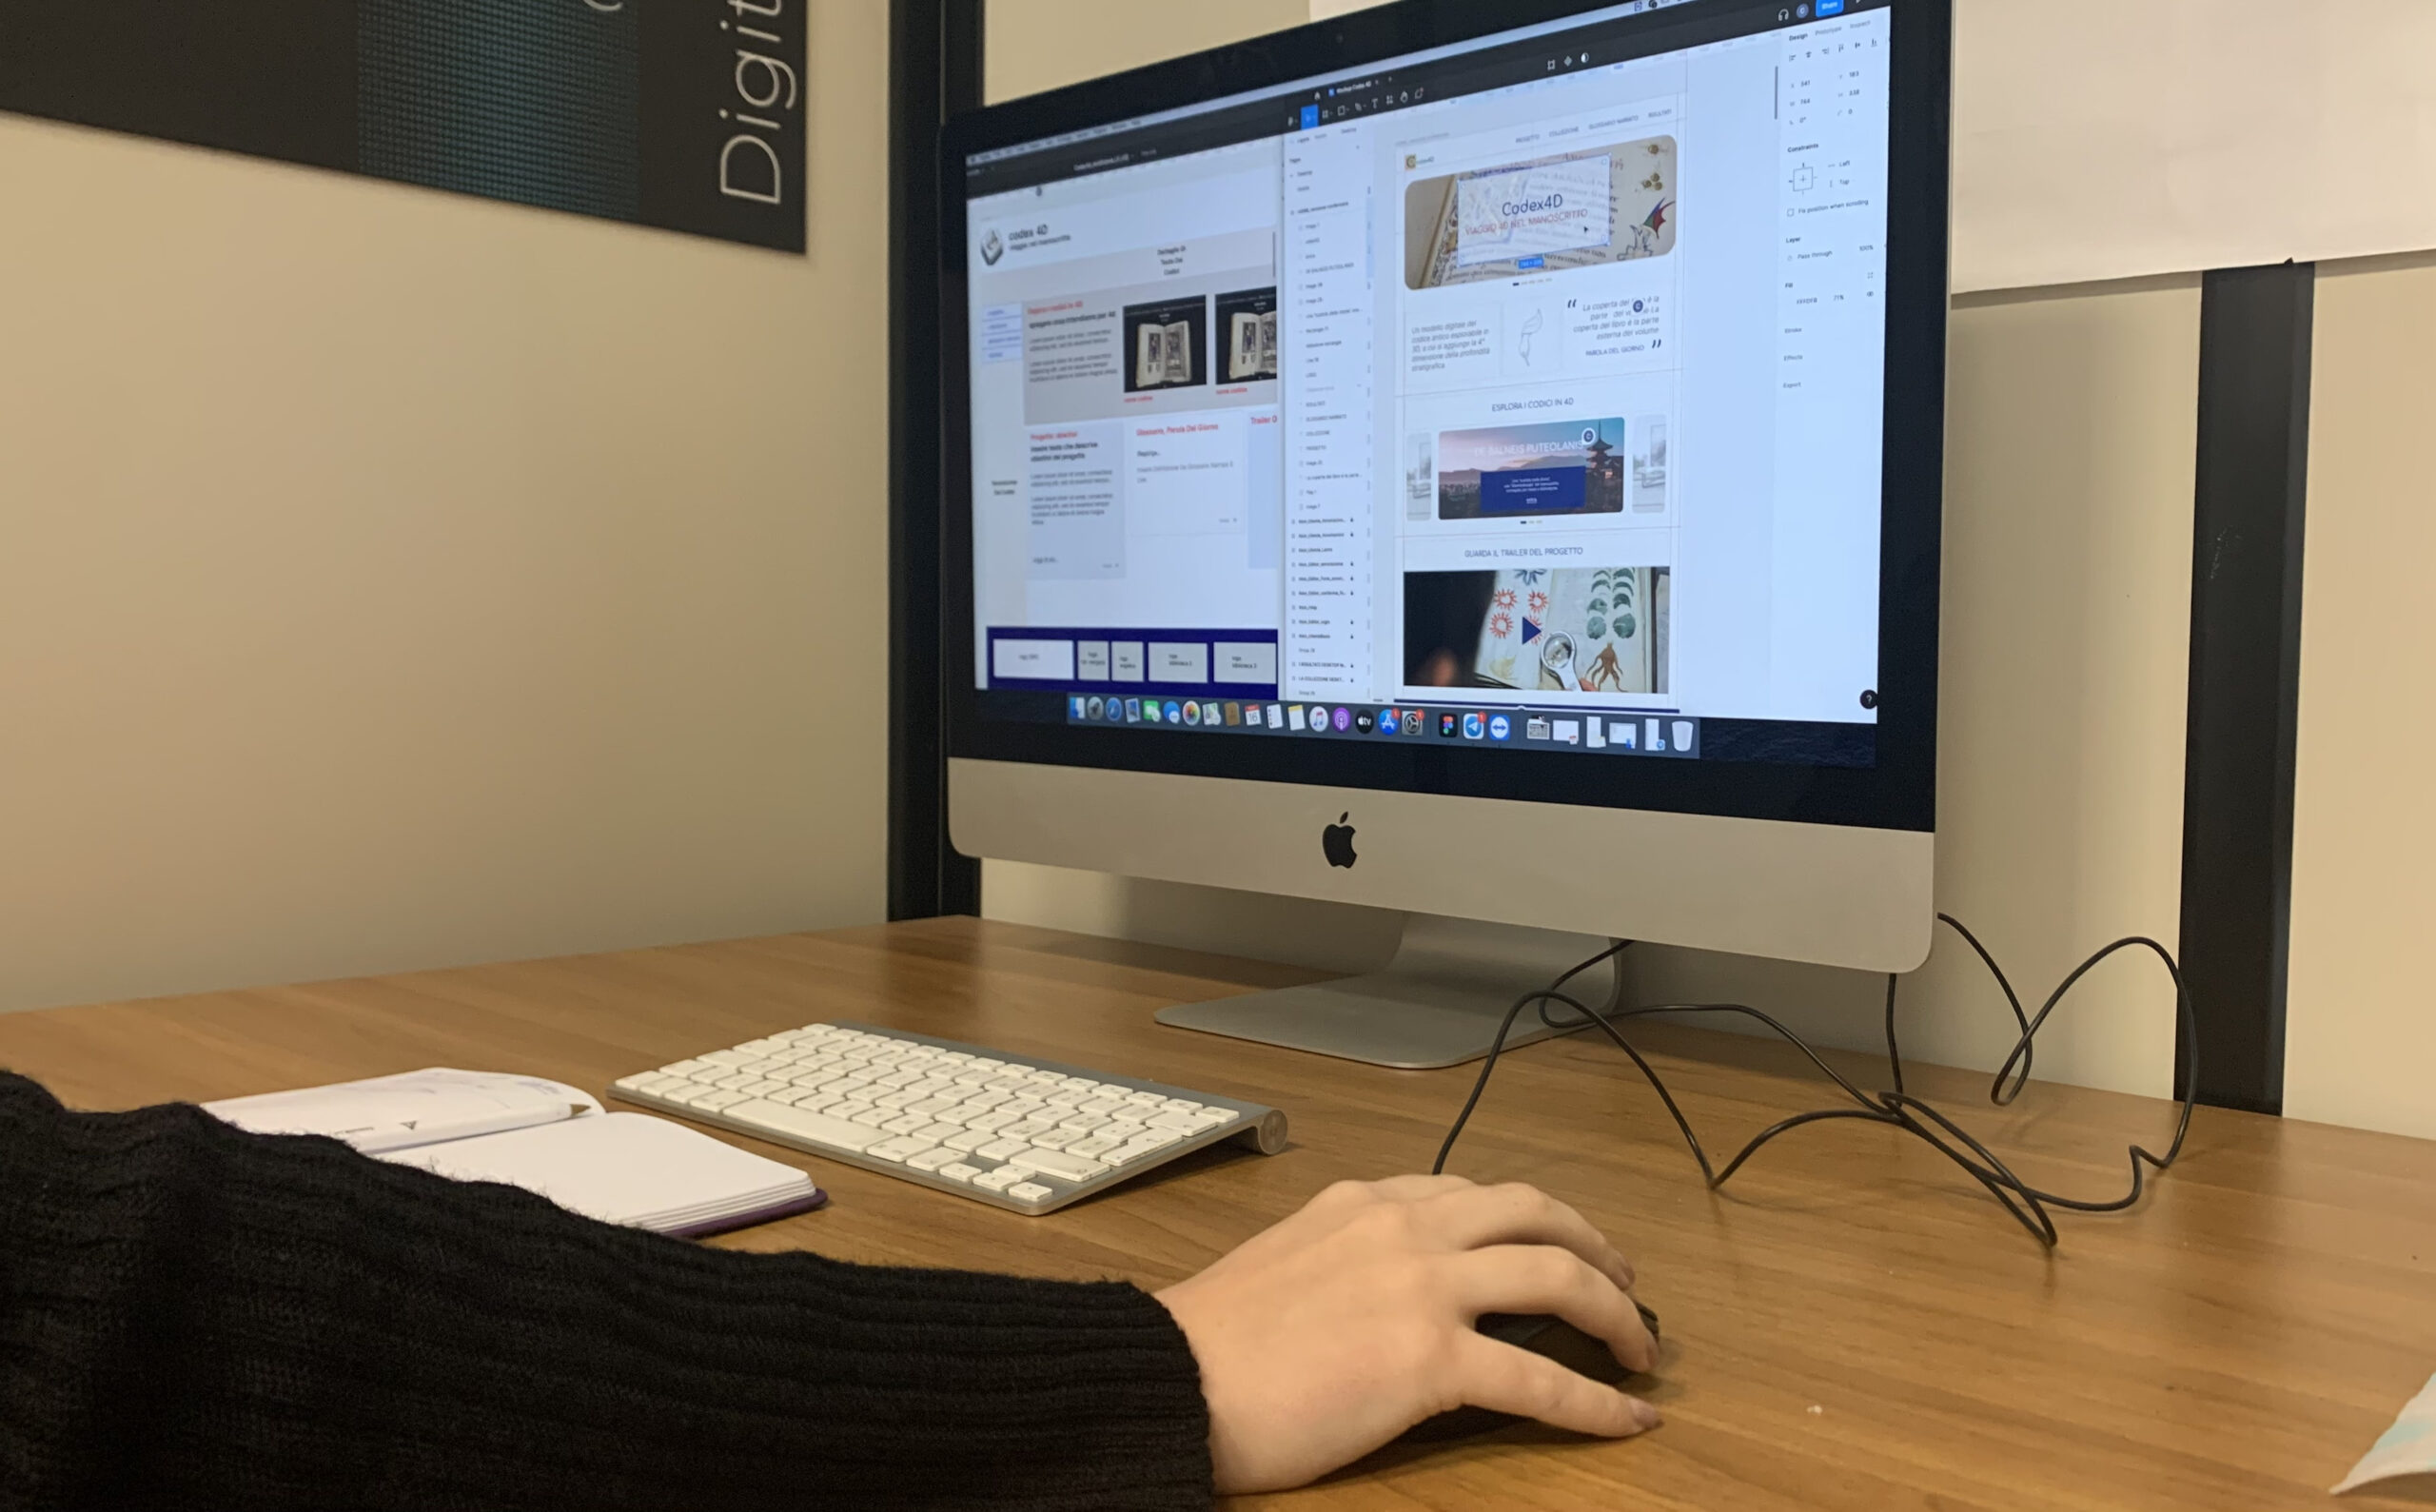
The skeleton of the Codex4D web-app was created, exploiting the modular structure of the ATON framework. Particular attention was given to the possibility of uploading multiple manuscripts and portrayals, making this web-app modular, integrable in CMS and scalable even with large numbers of 3D manuscripts/ portrayals.
3D models (manuscript views) from the acquisition phases were optimised and converted into interoperable 3D formats for the web context.
The User Interface (UI) was customised and adapted for Codex4D requirements, graphic layout, tool icons and functions.
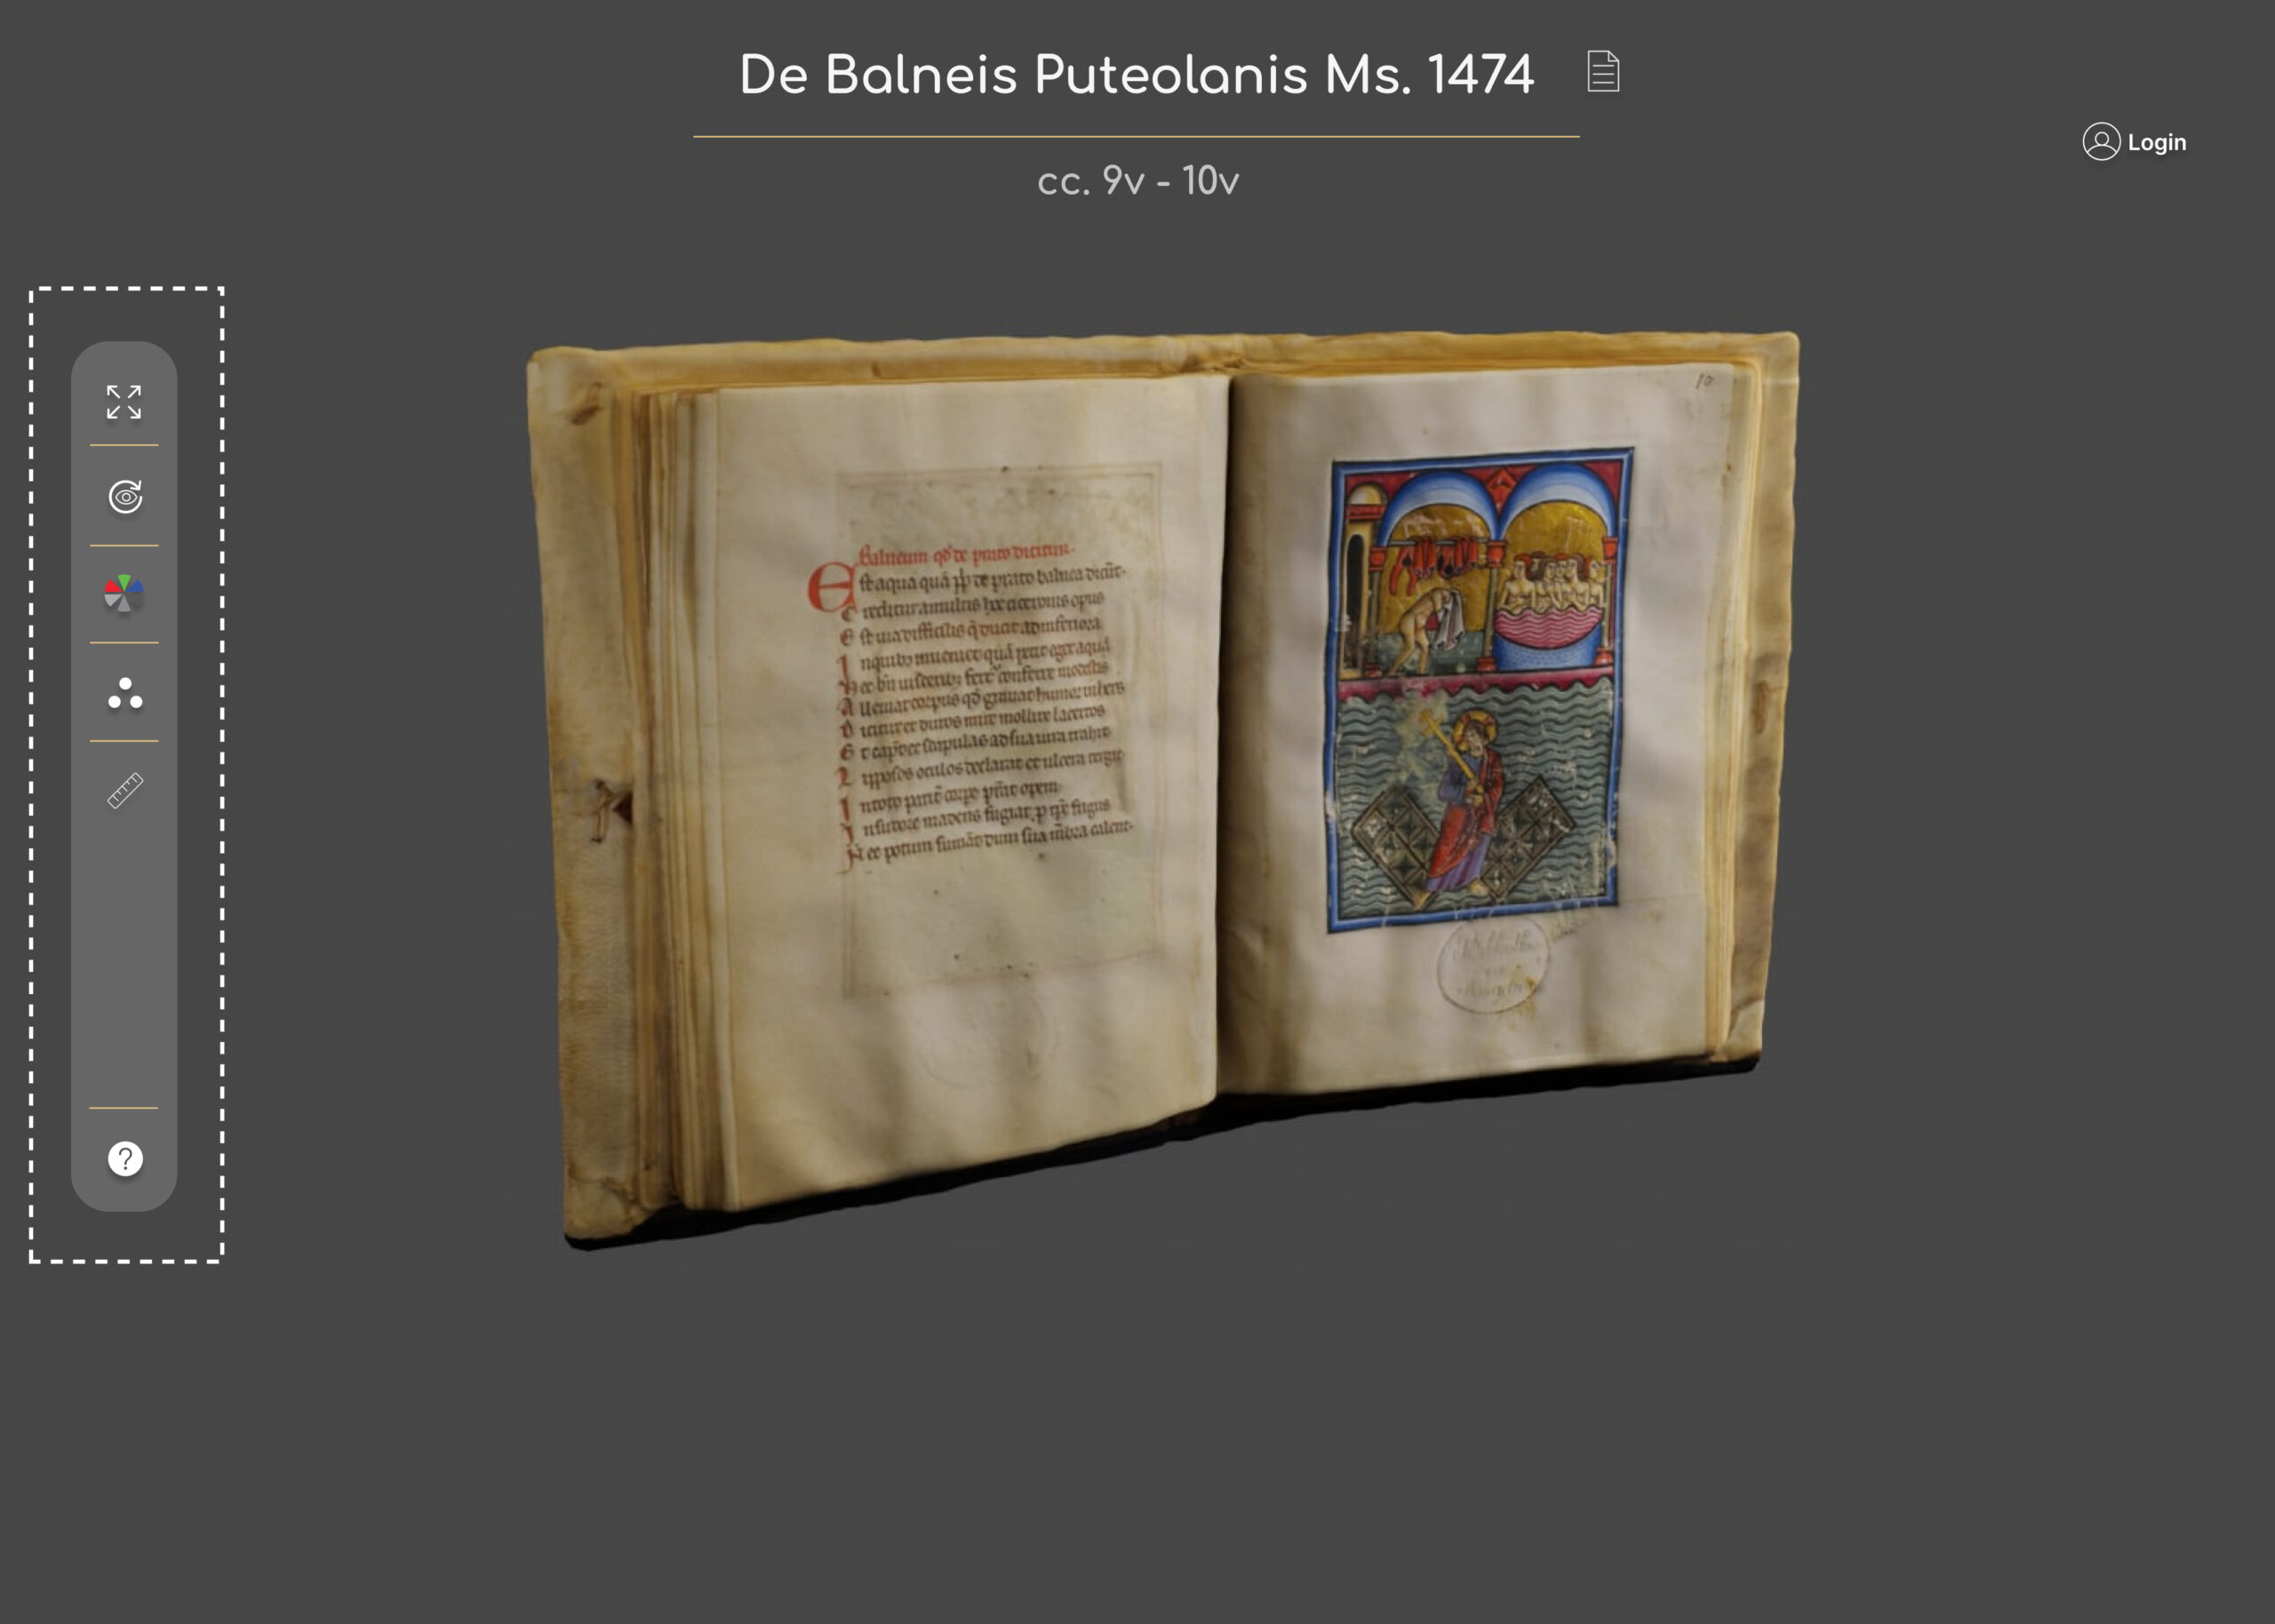
The basic routines for interactive inspection were created. These can subsequently be associated with elements of the user interface (UI) for both a generic public profile or for an editor profile (those who, by means of authentication, have the possibility of annotating a certain view of the manuscript).

- 3D model navigation
- Semantic annotation
- Measurement and discovery
- Authentication
- Customizable configuration
- Loading manuscripts and poses
- Setup and materials management
- Optimizing 3D poses for the web
- Conversion to interoperable formats
- Creation of 3D collection
User profiles or “personas” are described, based on interviews conducted with a sample of participants from different backgrounds. Groupings are made by similar behaviour. Then personas that are representative of groups of users are identified and described in a narrative. Then, the user journey, i.e. the representation of the path taken by the user, is developed.
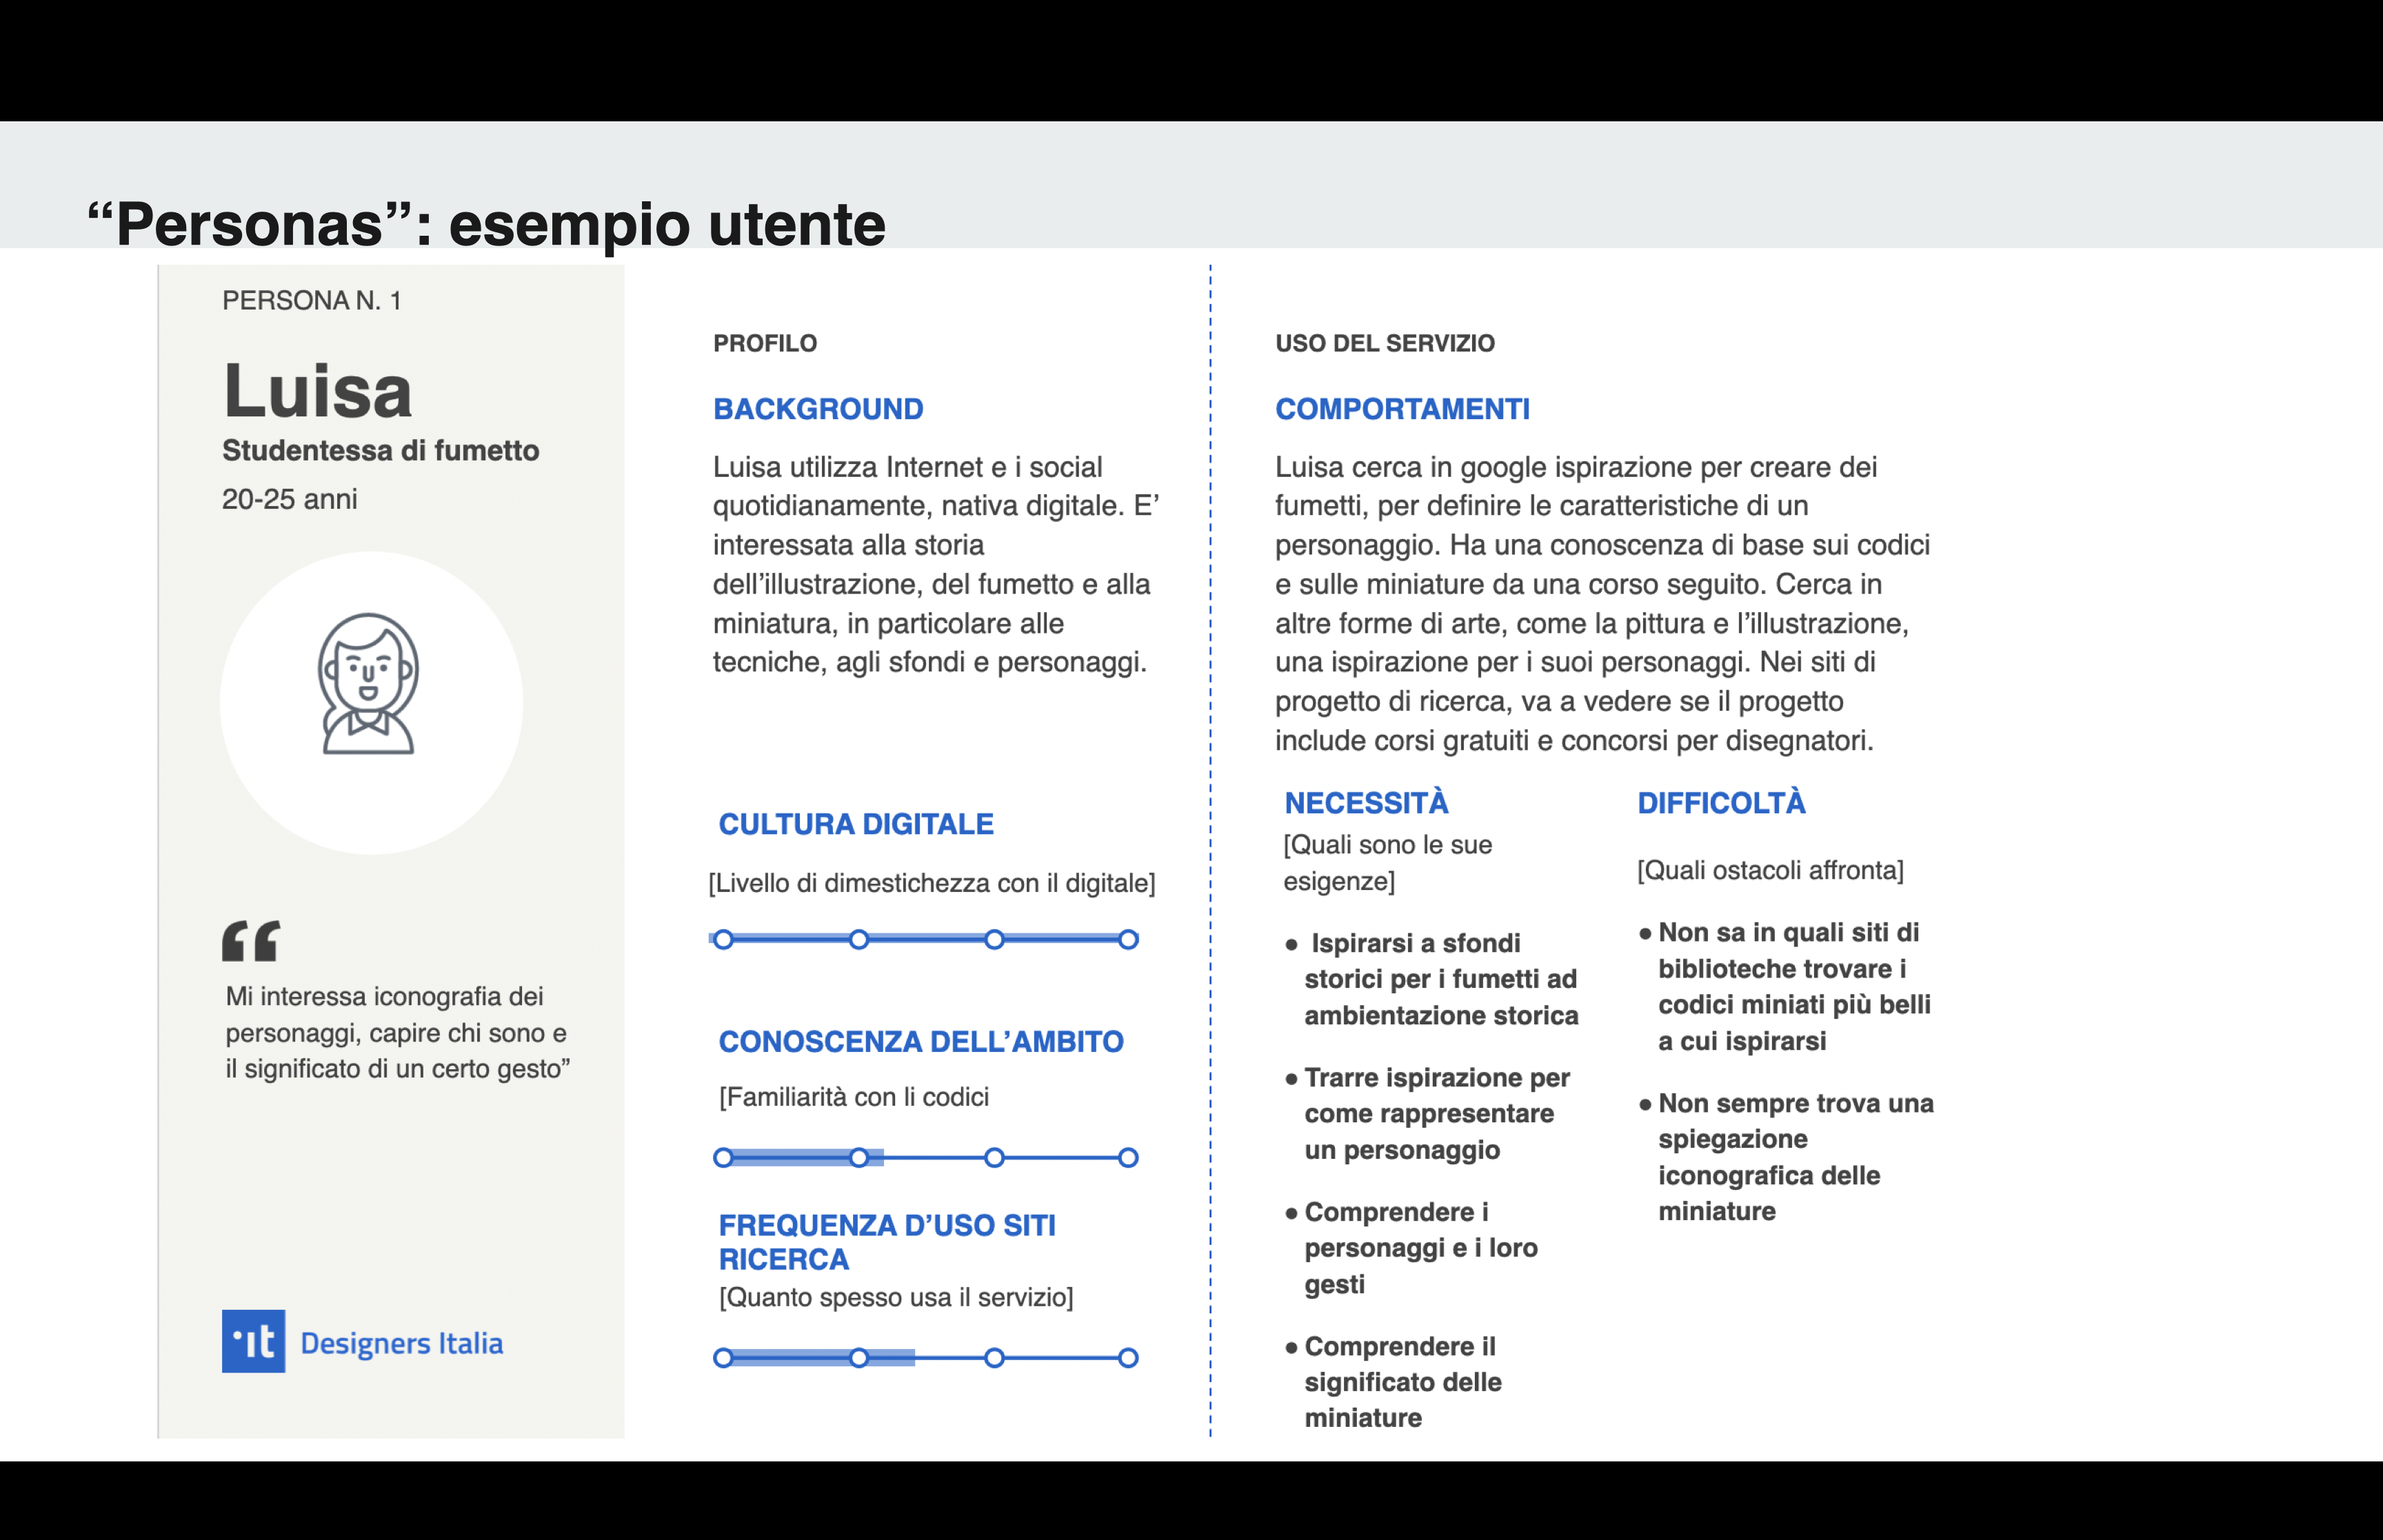
In co-design sessions, based on the personas, types of content are identified and the language style to be adopted is determined. If the project involves different types of digital media (site, holographic showcase, etc.), the contents will be appropriately articulated, based on the characteristics of that medium.
Content organisation and functionalities are defined. A tree diagram and flow diagrams are used to display the information architecture and processes. Next, wire-frames showing the positioning of the interface elements are made. Then, the mock-ups, with all final graphic components, are designed.
Assessments are carried out both at an intermediate stage and once the final version of the application has been made. Different methods are combined, such as usability testing, ethnographic observations, interviews, questionnaires, analytics, etc. These analyses are aimed at understanding the user experience, validating design choices, and improving the product.

Define sample, collect data, analyze them
Synthesize results with people
Co-design of content types
Writing for different media
Wireframes and mockups
Prototype
The set-up involves placing the artefact on a lectern or in a horizontal position, connecting the fibre optics to the halogen illumination lamp and to the spectrometer. Then, the system is connected to the PC and the lamp and spectrometer are switched on, in that order. The system has to warm up for at least 20 minutes. The measuring fibre optic is attached to a metal rod to allow measurement in a non-contact mode and to keep the probe as stable as possible at the point of measurement.
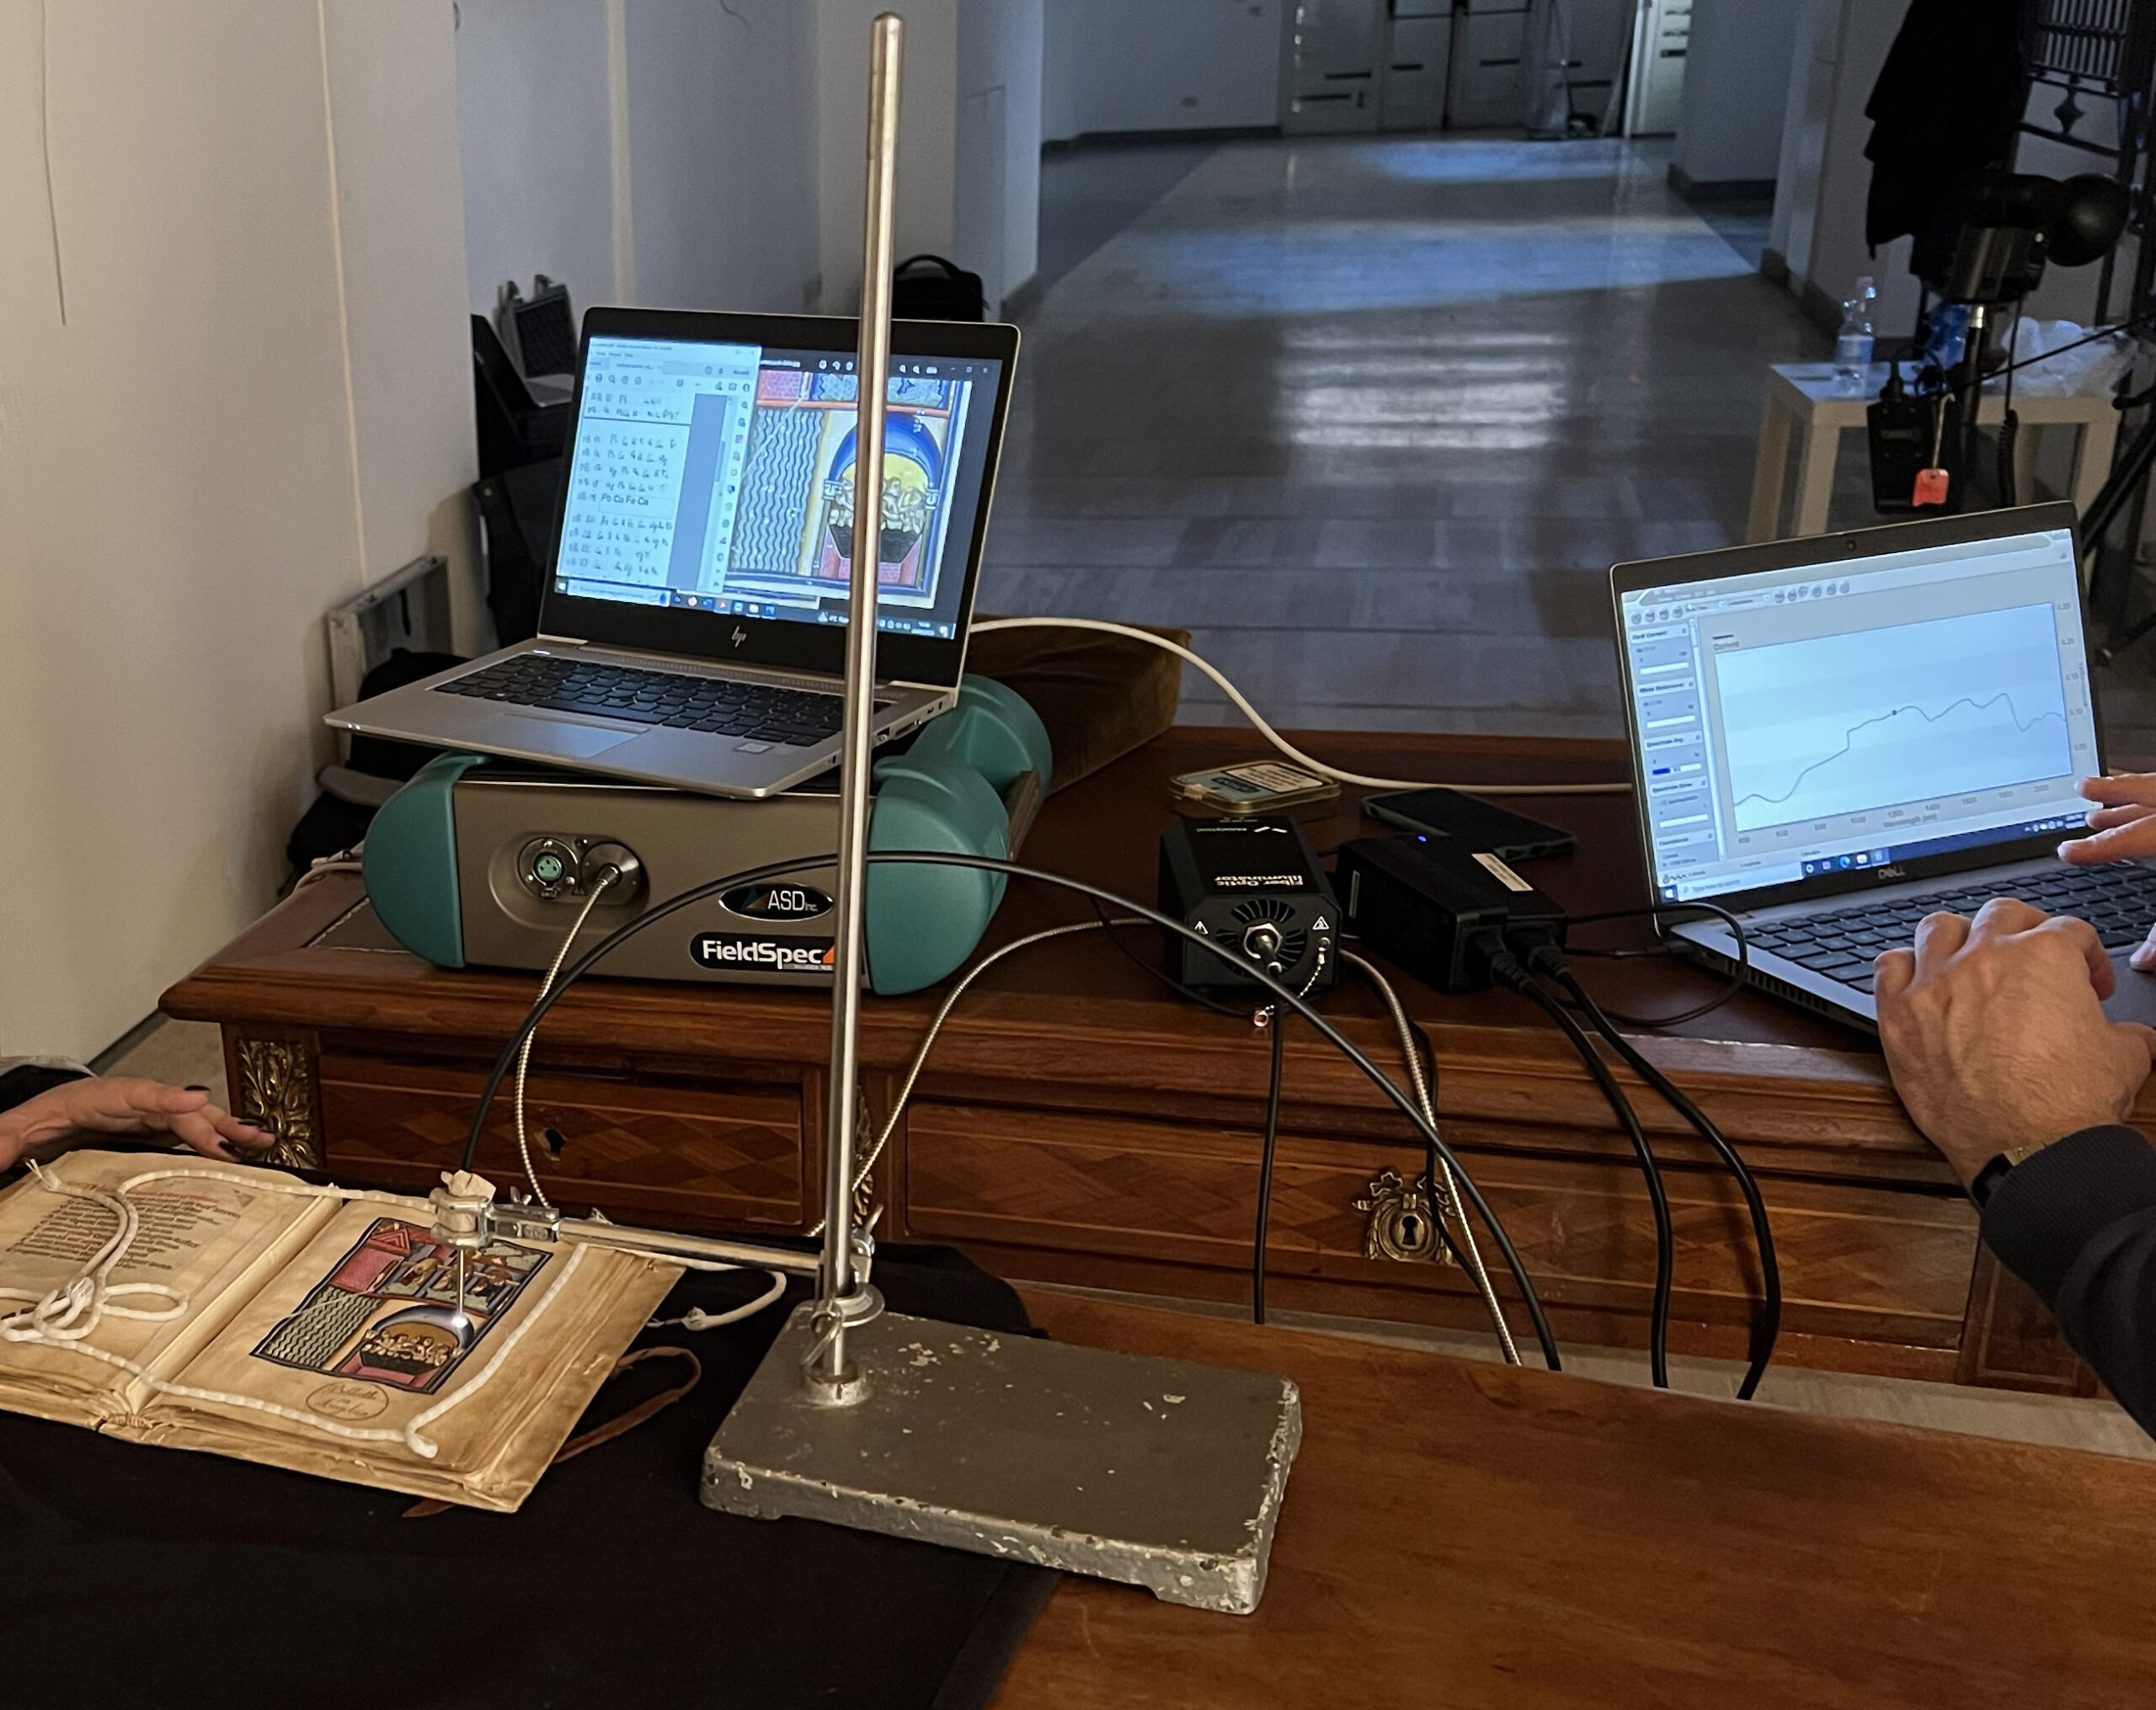
Spectrometer for UV-vis-NIR reflectance measurements - Acquisition system
Measuring points are selected a priori on the basis of those previously analysed with other point or imaging techniques so that complementary data to aid interpretation of the result can be obtained. When selecting the measurement points, the complete characterisation of the entire pictorial palette used in the object under examination should be taken into consideration.
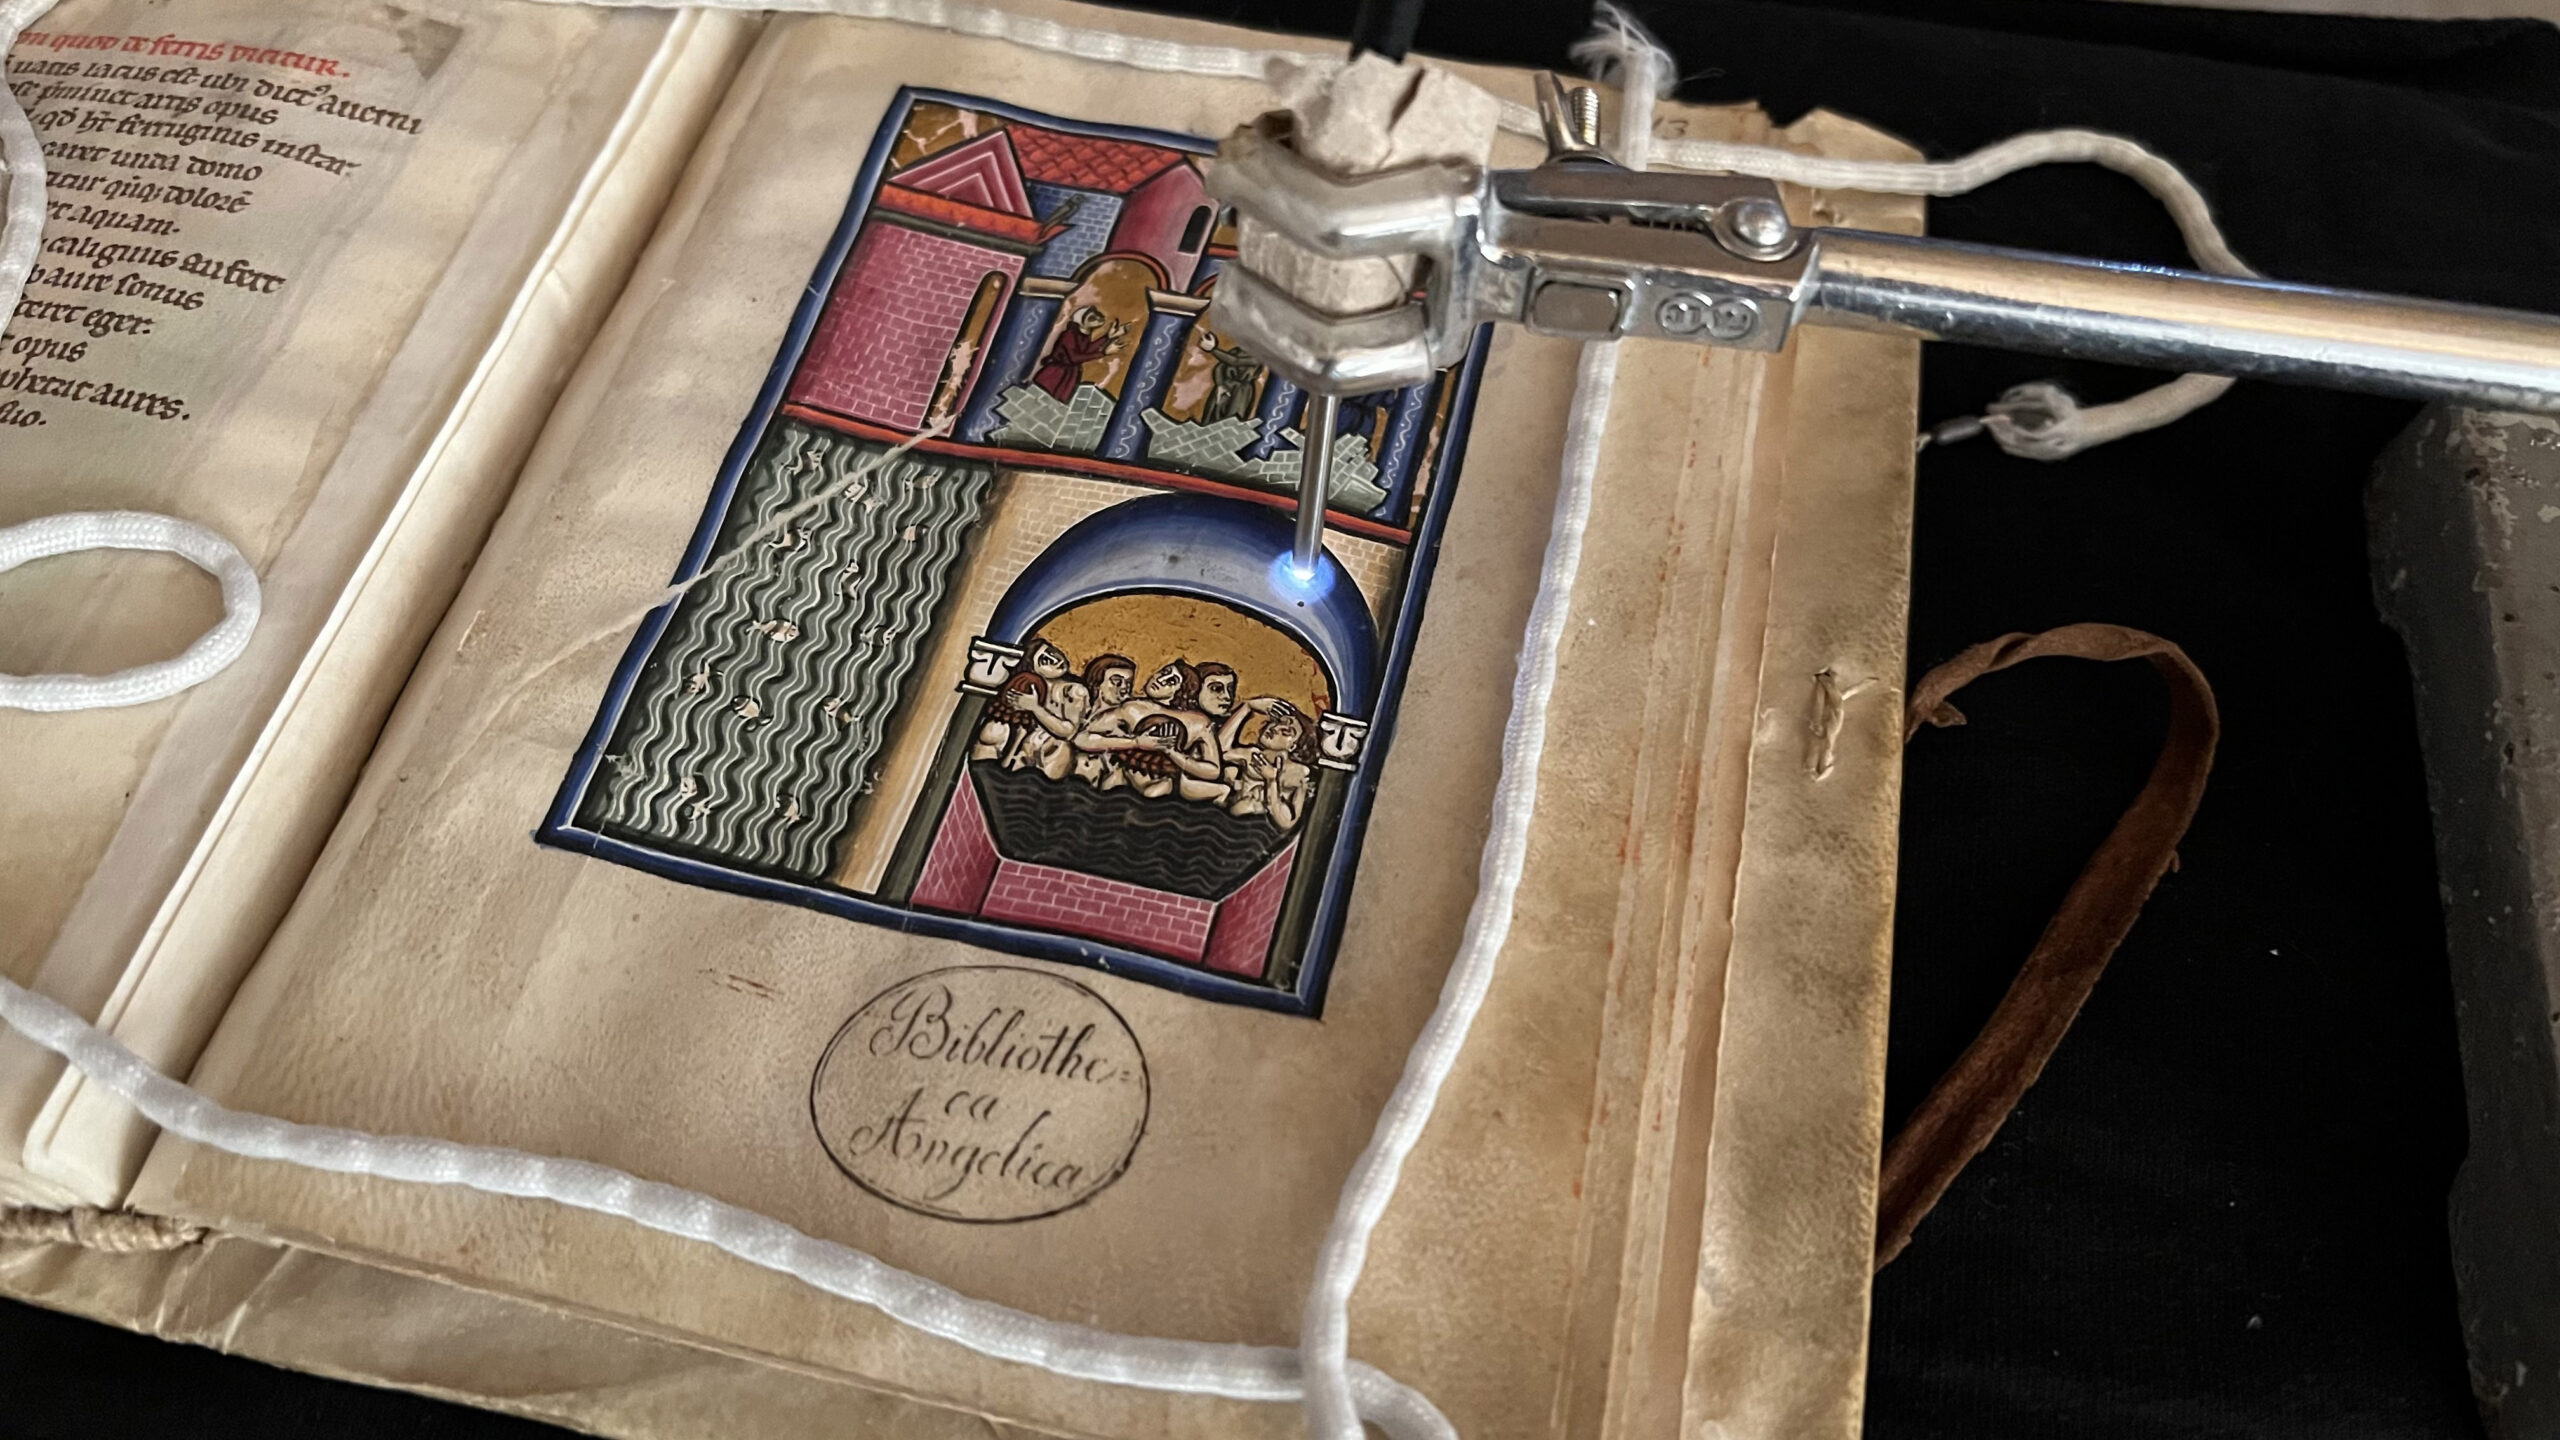
Positioning the probe at the desired measuring point
The probe is positioned on a white reference standard and the system is calibrated. Once calibrated, the probe is positioned approximately 3-5 mm above the area to be investigated. The spectrometer records the signal reflected from the surface of the object under investigation continuously. When a spectral signal characteristic of the area under investigation is obtained, the spectrum is saved.
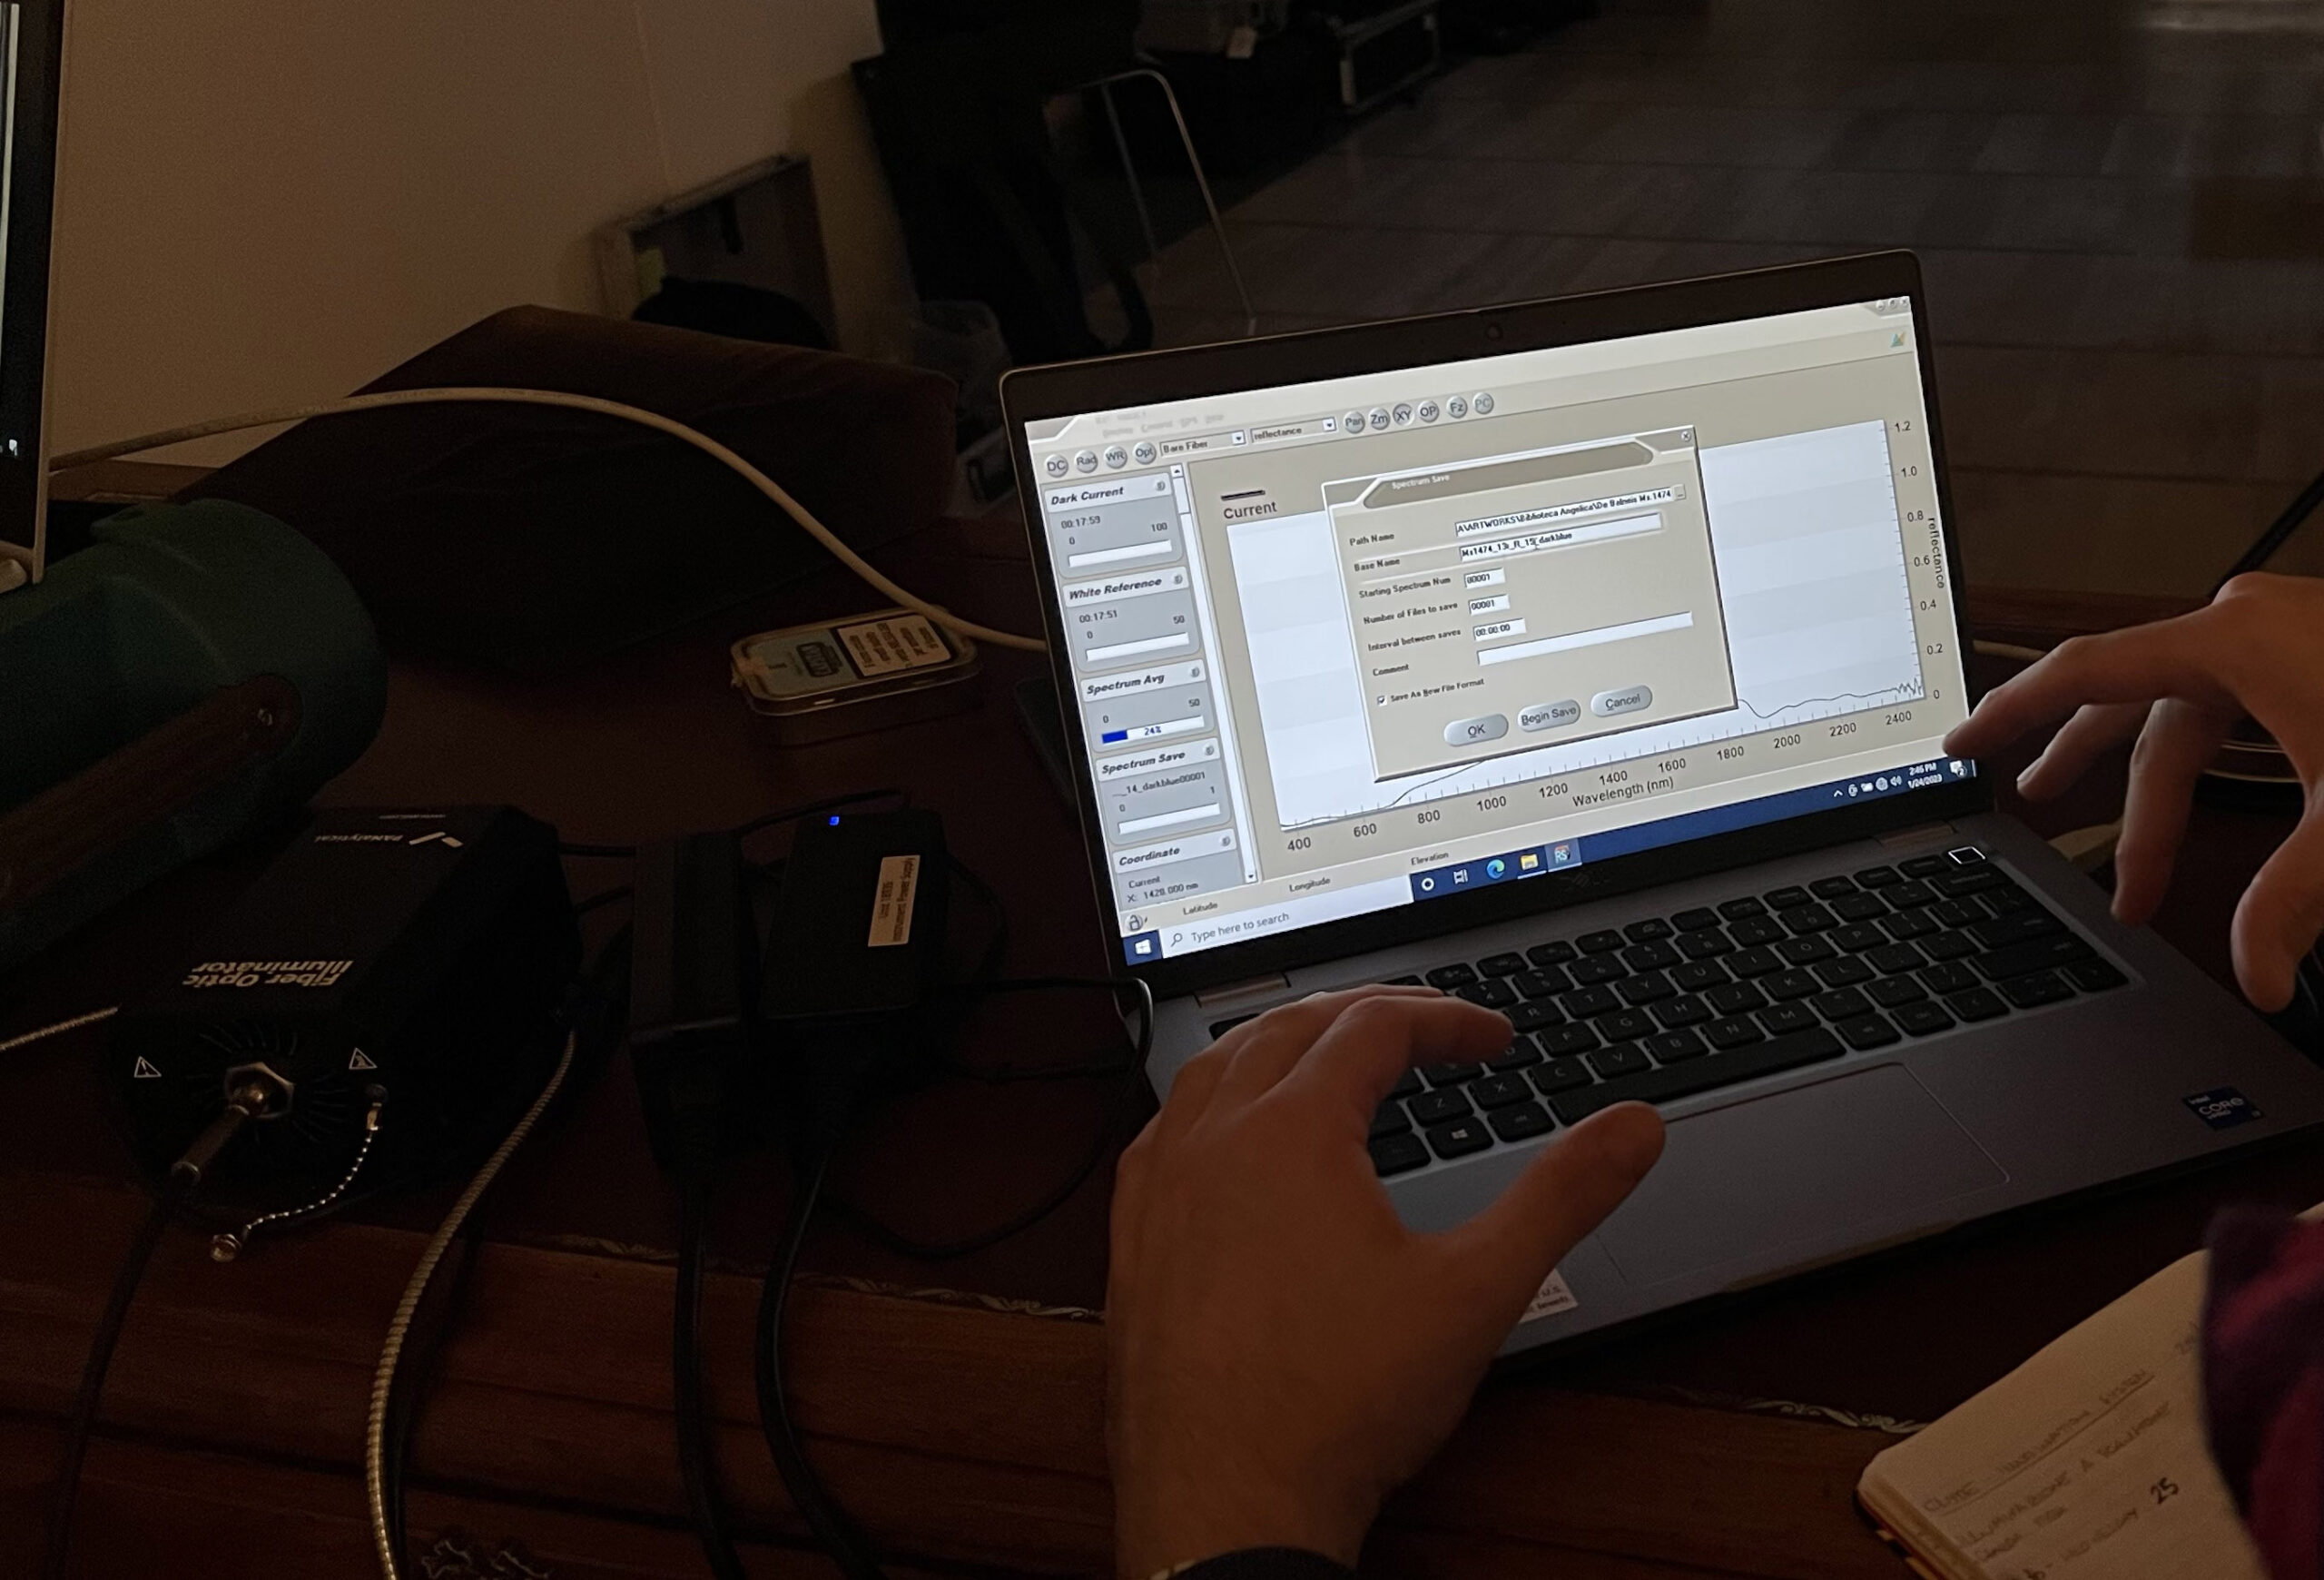
Acquire and save the spectral profile
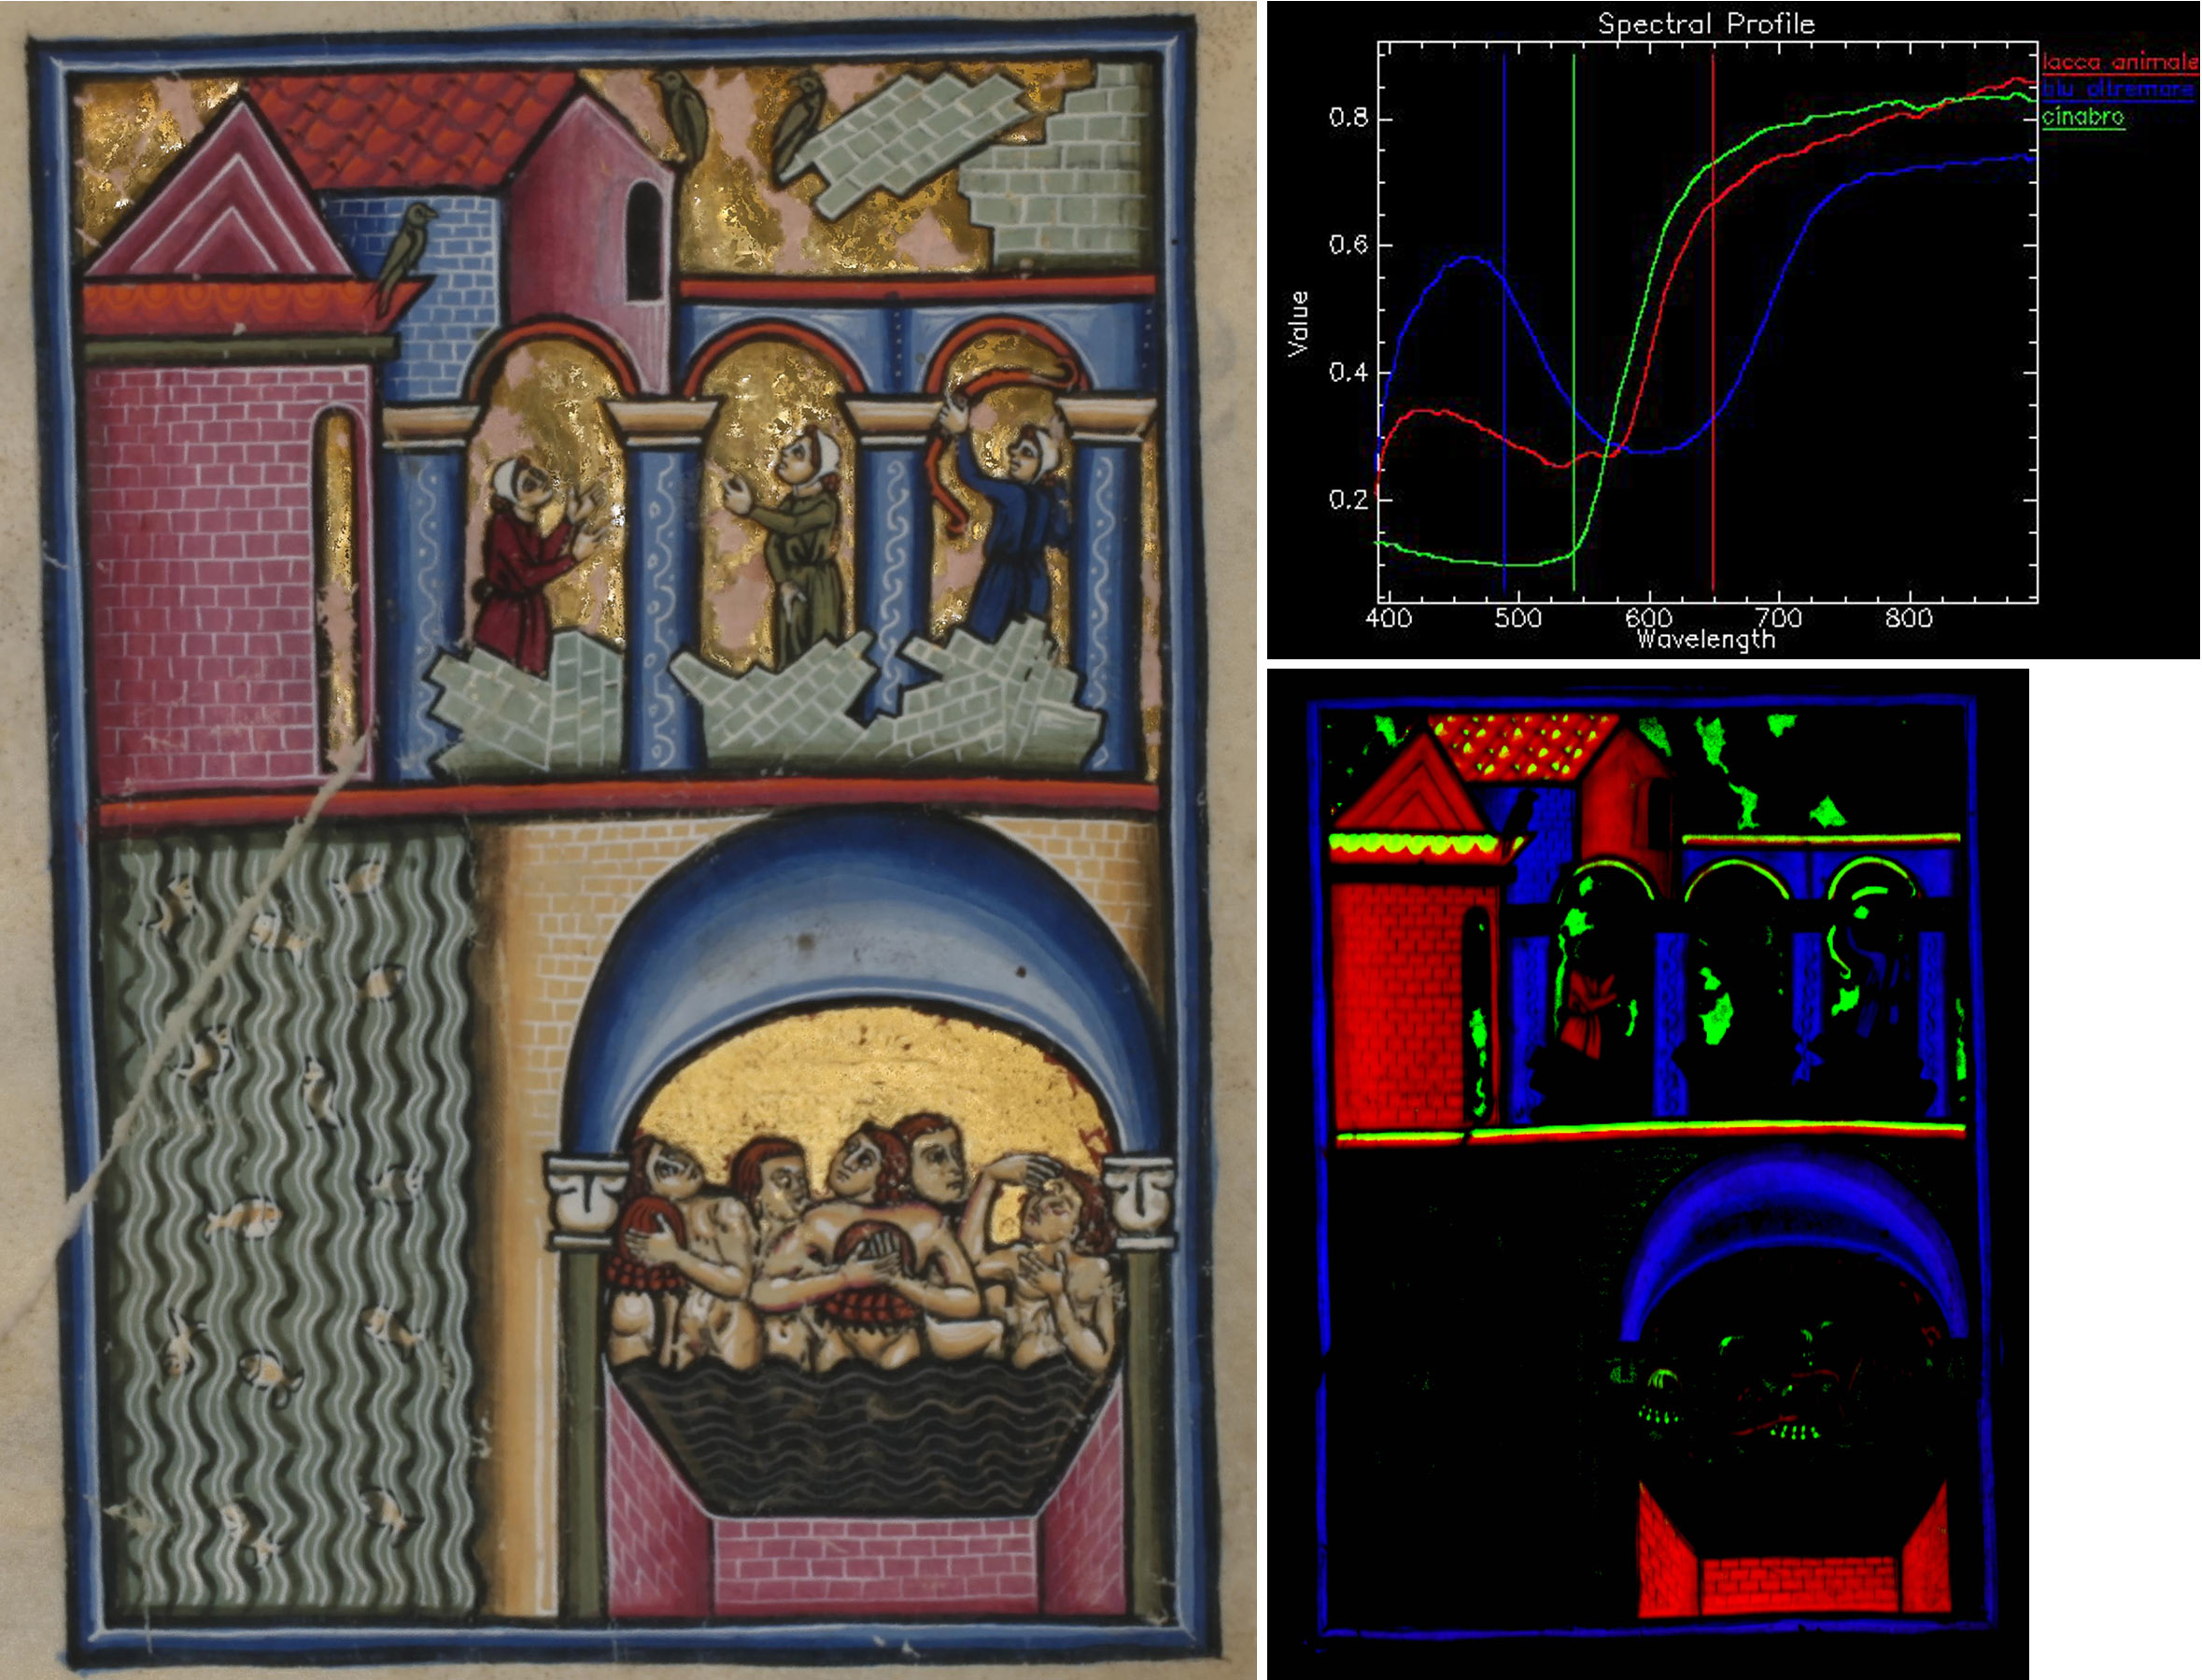
On the basis of spectral databases and scientific literature, the signals present in the UV-vis-NIR spectrum are identified. The signals present are characteristic of pigments, dyes and several organic materials (such as binders and paints). To read the signals recorded by the spectrometer more easily, the spectra can be processed mathematically (e.g., calculation of first and second derivative).
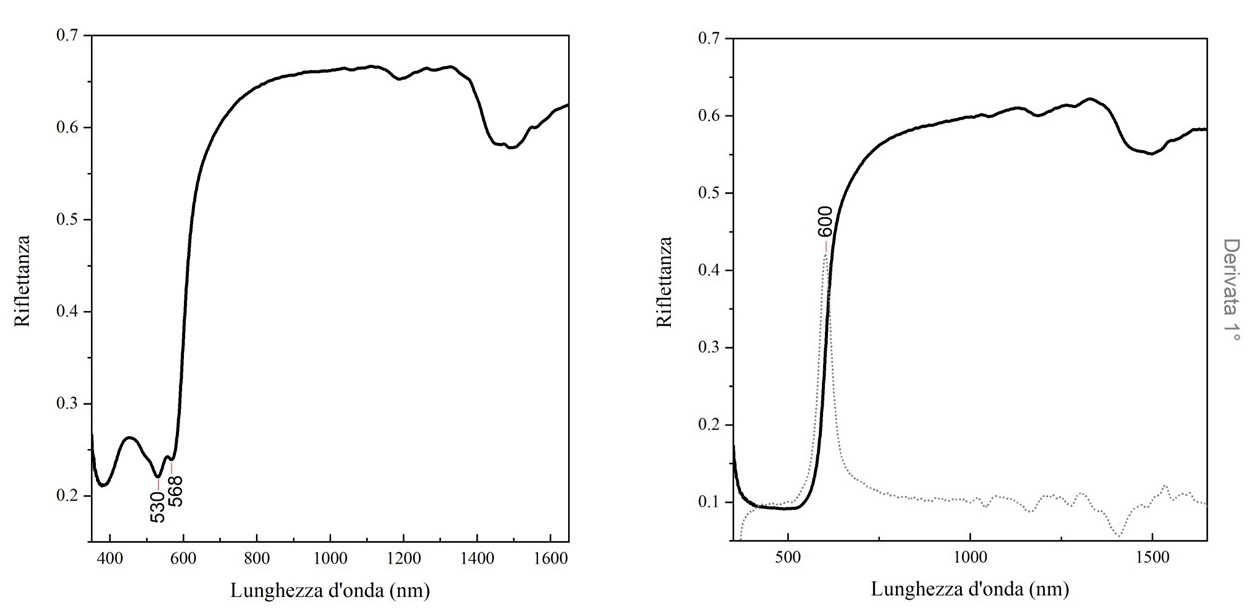
UV-vis-NIR spectrum of an area painted with animal lacquer (left); UV-vis-NIR spectrum of an area painted with cinnabar (right). To identify the precise position of the cinnabar flexure, the spectrum was displayed as a first derivative (grey line).

System assembly
Connection with computer
Definition of the points to analyze
Build on areas already analyzed with other techniques
Recording of punctual spectra
Acquisition of different spectra on the same color fields
The set-up, defined on the basis of the manuscript dimensions and the area to be analysed, involves positioning the artefact on a lectern, with halogen lamps (for reflectance measurements) or 405 nm LEDs (for fluorescence measurements) set at an angle of 45° to the codex, positioned at a variable distance measuring from 50 to 100 cm. At the side of the image, reflectance hyperspectral imaging in the visible range (left) and fluorescence imaging (right).
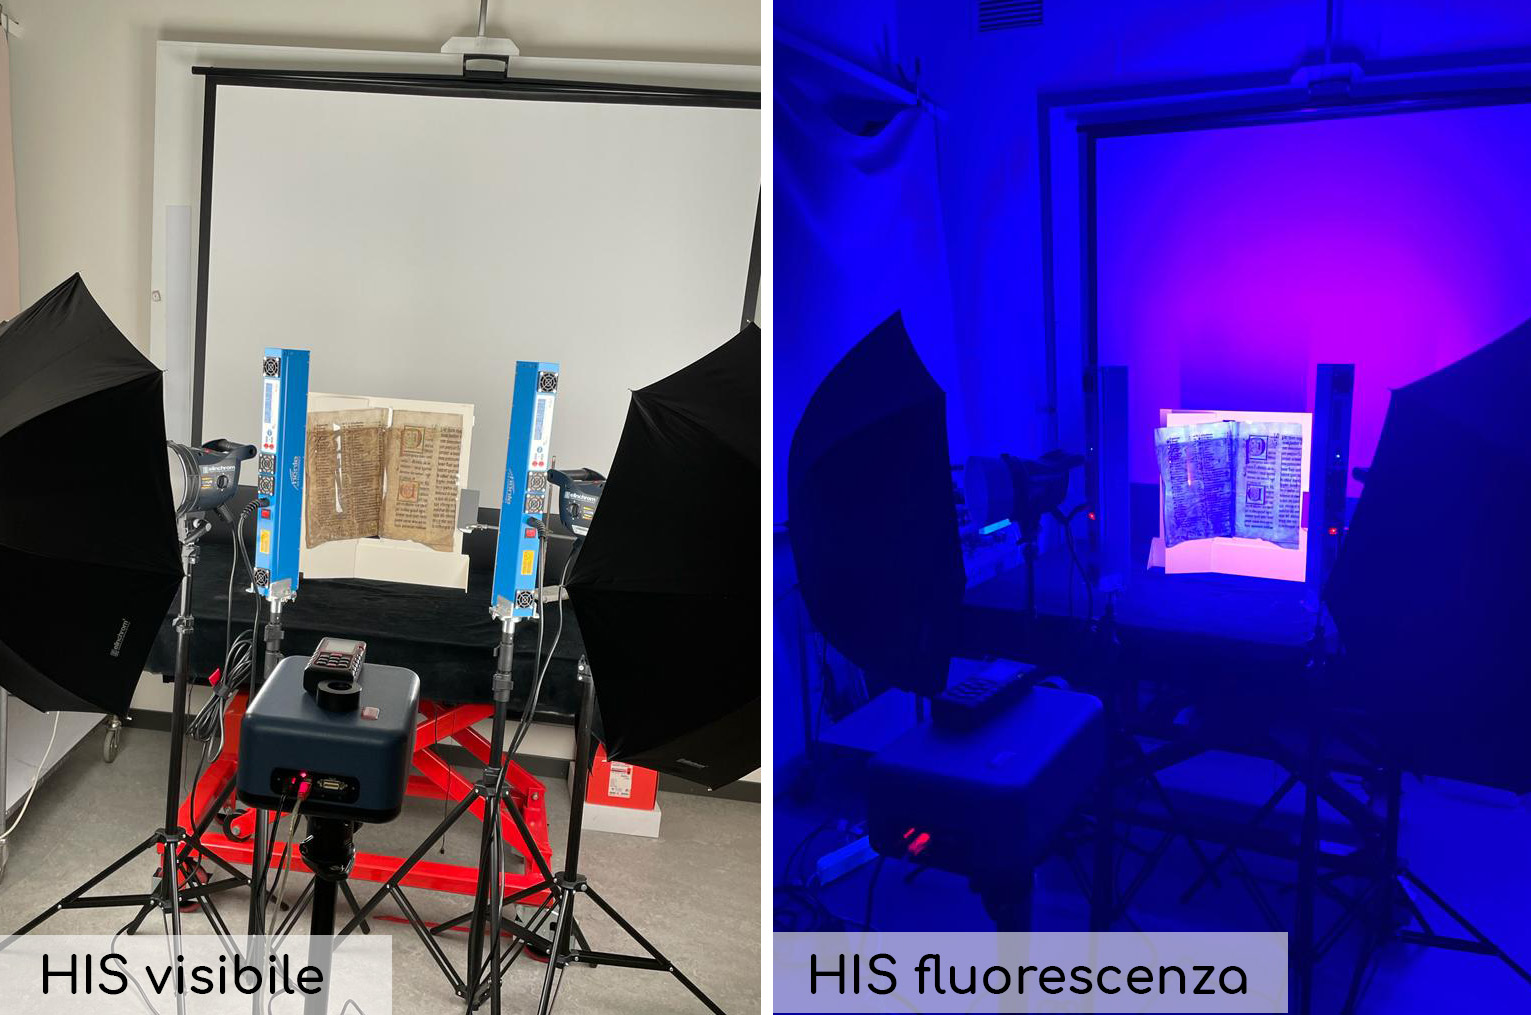
Acquisition consists of recording hyperspectral cubes in reflectance or fluorescence during illumination of the codex with halogen lamps, in the first case, and LEDs at 405 nm, in the second case. The illumination is continuous while the hyperspectral camera is shooting. When taking a reflectance measurement with halogen lamps, the camera records the signal reflected and absorbed by the code page. When taking a fluorescence measurement with LED lamps, the camera records the signal emitted by the code page when it is excited with radiation with a wavelength of 405 nm.

Positioning:
- Artifact
- Halogen lamps
- LED lamps
- Hyperspectral camera
Activation of lamps
Hypercube registration